Architecture, configuration, optimizations, all come a bit later - let's approach this from a more end user perspective.
This below is a Discoverer worksheet. A table actually. Shows me Profits, Sales, by Year, Region, and City. Plain vanilla report - took me less than five minutes to create it (probably closer to two, but then I was not timing myself).

The two parameters also have default values - 1998 for Year, and 'West' for Region. This is useful for reasons we shall see later (in other words - 'trust me, I know what I am doing').

While I go about describing that process here, please do excuse my graphical loquacity (i.e. I shall use more screenshots than you may need or want, but this isn't about needs or wants).
Go to BI Publisher and create a new report under a folder of your choice.
But first you have to login.

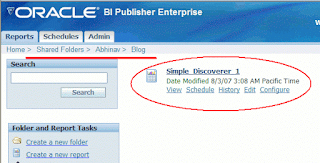
Here is the folder I created ("Blog" under "Abhinav" under "Shared Folders").
And the report I created is "Simple_Discoverer_1" (I do have a gift with names).


This is good, because you do not want an empty report with no data and no layout to get possessed...
Create a new data model first. That sounds difficult? No it isn’t. Simply click 'Data Model' and then click the 'New' icon.


See all the arrows in the screenshot below? After your data set has been defined, click 'Save' (would it be a good idea to have an 'auto-save' type functionality here?)

Done that? Good. You are good to go – at least in terms of viewing your data via BI Publisher. Click the 'View' link and you can already see a couple of things.
Firstly, the Discoverer parameters are now available here in BI Publisher. And the default values have been pre-selected.
Secondly, since I had specified in the Discoverer workbook that these parameters could accept multiple values, the LOV in BI Publisher appears as a multi-select list box. If these had been single value parameters, these would have been dropdowns so you could select only one value.

Thirdly, you can view the data, but there is no formatting or layout, still. That again is expected. After all, we haven't associated a template with this report yet. But you can see the XML here. It's in a rowset form, and the Discoverer web services have done this. And this is perhaps the most critical part of the whole integration. It doesn't really matter how the data gets from Discoverer to BI Publisher, as long as it is in this format - rowset - that BI Publisher understands and can work with.

Scheduling and Distribution
Before we (I am using the royal pronoun here... there's only me writing this post, right?) get into the template building part where you can use the formatting capabilities of Microsoft Word to create nice looking reports with BI data in it, let’s see just what we can do with this bare bones report that has no template associated with it.
Specifically, I want to try out two things (things always have to be exposited in twos and threes when I speak - annoying habit).
Firstly, and this is what many Discoverer customers want to do; schedule and distribute Discoverer content to users.
So, click the ‘Schedule’ button, which takes you to the BI Publisher scheduler. There, change the parameters if you want to, or leave them as they are. Set up a schedule – for convenience I chose to run the job immediately. Furthermore, specify that you want to destination to be email. My email. But of course.


