Pages

Showing posts with label Office. Show all posts

Monday, July 08, 2013

Smart View Version to use with OBIEE 11.1.1.7.1

Users who have downloaded the latest version of Oracle Business Intelligence 11g - 11.1.1.7.1, and wish to use the Oracle Hyperion Smart View for Office add-in to connect to Oracle BI, need to use the latest version of Smart View - 11.1.2.3 - that is available for download on OTN here.
After downloading this version of Smart View, if you want this version of Smart View to be available as a link from the Home Page of Oracle BI EE (the "Download BI Desktop Tools" dropdown under the "Get Started..." section), you need to follow the instructions (also see Installing and Deinstalling Oracle Business Intelligence Client Tools)
You can find more information in the BI documentation library (Business Intelligence Documentation for Oracle Fusion Middleware 11g (11.1.1.7)) or in the Oracle Essbase Documentation Library, Release 11.1.2.2.200

Happy Monday!
Abhinav,
Bangalore, July 08, 2013

Wednesday, October 17, 2007

BI Office in 10.1.3.3 - Secure Image

I don't like the image that appears after I have secured BI charts.

So you don't like the image and want to change it. Change is good. And you can have it.
How?

First a brief recap.
I am talking about Oracle Business Intelligence for Microsoft Office in the 10.1.3.3 release of Oracle Business Intelligence Suite Enterprise Edition.
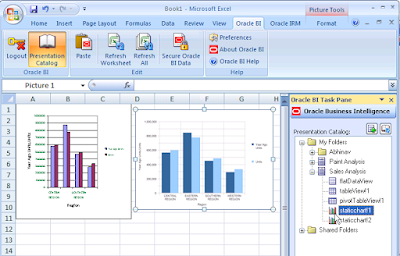
Given a BI chart (specifically, given a chart that has been inserted into Excel or PowerPoint using the Oracle BI Office Add-in)- as a native Office chart, or as a refreshable image, or as a refreshable Flash chart - you can secure it.

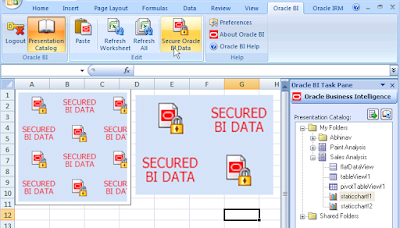
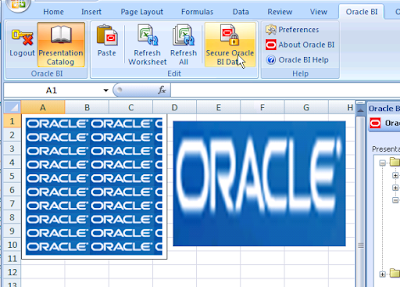
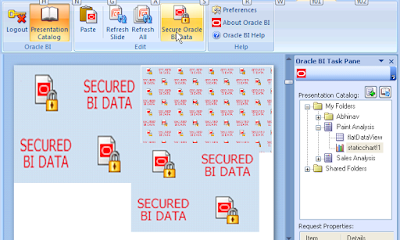
And once secured, this is what appears in place of the chart data:


Refresh it and back appears the chart and the data.

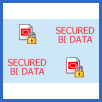
What we want to do is change the image that appears. This image:

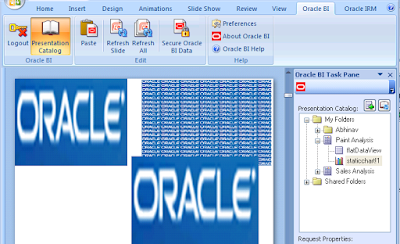
And let's say I want to put in its place this image:


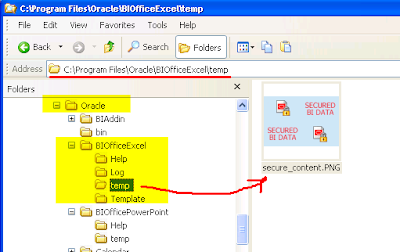
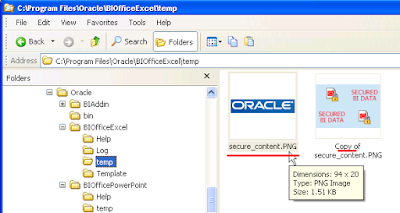
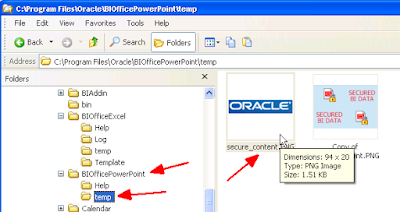
To do that, for Excel to begin with, go here:


c:\program files\oracle is obviously where you installed BI Office.
You will see a file named "secure_content.png"
Make a copy of it if you please. And then copy the image of your choice (yeah... we can have the imagination run wild here. But not now) to this folder.


Now go back to Excel. And try the secure operation again.


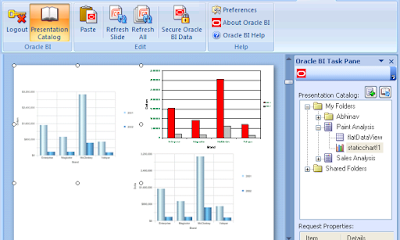
There you go. You could do the same with PowerPoint too.


Go to this folder:


Replace the default image with this one:


Note that the secure_image.gif file is generated by the Add-in if it is not there - so if you do delete it, then it shouldn't really matter, I think, as it will be regenerated the next time you click the 'Secure Oracle BI Data' button.

Monday, August 27, 2007

Do you have .Net 2.0?

The Oracle Business Intelligence Add-in for Microsoft Office (Excel and PowerPoint) requires the
.Net 2.0 Framework. The client installable comes prepackaged with the x86 32-bit .Net 2.0 redistributable, which adds approximately 22MB to the download size of the BI Office Add-in.

My question is: do you already have the .Net 2.0 Framework installed on your Windows PCs? Please take a few seconds to use the poll I have created to answer (the poll is also visible on the blog's home page in the sidebar).

Many thanks!

Thursday, August 23, 2007

BI Office in 10.1.3.3 - Flash

Or why the BI Office in 10.1.3.3 provides the ability to insert BI Chart views inside Excel and PowerPoint as native Office charts, or as static images, or as Flash objects (only in PowerPoint).

Why Flash? No of course you shouldn't.
Isn't Flash only for movies? Isn't Flash only for animated content? Isn't Flash only for 'this' or 'that'? Aren't Flash charts supposed to jiggle, wiggle, wriggle, and do animated dances? No, I submit to you.

I would suggest you go to Wikipedia and read up this page that describes the fascinating history of Flash - the player, the platform, and format, all. Also read this page on Wikipedia - Category:Graphics file formats, lots of very useful information there.

As far as BI EE is concerned, Flash charts offer greater quality and interactivity than raster based image formats like PNG or JPEG.

BI Presentation Services however do offer you the choice of having charts render in vector based Flash or SVG formats, or as raster based PNG or JPEG images.

The way to do that is to modify the instanceconfig.xml file and specify the chart format thy heart desires. If your Oracle BI data directory is "C:\OracleBIData" then the instanceconfig.xml file can be found under the C:\OracleBIData\web\config folder.


Open the instanceconfig.xml file using a text editor and insert these three lines in the file:

<charts>
<defaultimagetype>PNG</defaultimagetype>

</charts>


Save the file.
Restart your Presentation Server. You can use Windows Services or the command line to do that (net start "Oracle BI Presentation Services")


After that go to Answers and view any chart that you had created earlier (you could even create new charts, but I thought this may be quicker), and check the properties of the chart that comes up:

Since I specified PNG as the image type, the bar chart below shows up as a PNG image in Answers.


The same bar chart as a JPEG image.


And as an SVG image.

(ठीक है ठीक है) theek hai theek hai I get it.
All this is also available in the documented Presentation Services Administration Guide (PDF): see the section "Specifying the Oracle Business Intelligence Chart Image Type" on page 50 of the doc.

So, coming back to the original question, "why Flash", the short answer is that Flash is a vector based image format and provides better quality, more interactivity (like mouse over tooltips, etc...), and charts inserted as Flash objects in presentations generally tend to look better than raster based images.

Let's elucidate with an example.

Compare these two screenshots. The one below is a bubble chart inserted as an image inside a PowerPoint presentation.

And this screenshot is of the same chart inserted in PowerPoint as a Flash chart.

As you would see the quality of the two charts is different. With the image based format there is some amount of pixelation and some blurriness in the image, but not so with the Flash chart.
But, surely, you could argue that the answer is simply to have larger sized charts in Answers in the first place. Yes, I could have a larger chart in Answers, and when I add that (larger chart) to my slide as an image the quality won't suffer. True. But that’s more work, and you may not always want to go to Answers to change your chart size- it could have unintended consequences (if you insert that chart in a Dashboard page it shall occupy an inordinately large amount of screen real estate for one). Increasing the size of the chart increases the size of the image file generated when you insert it in PowerPoint for example, but with vector based formats there is no change in file size:

See with another example:
For a pretty small chart the size of the image file is 22KB


while the Flash chart (.swf file) is 26KB (actually a little bit larger than the image file).


Now, if you increase the size of the chart, the size of the image file more than doubles to 58KB


while the Flash file increases in size by only 20% to 31KB.


And to illustrate it even better, these below are two screenshots of the same chart view.
In this case I have scaled the chart image to 200% of its original size and then taken a screenshot:


And in this case below, I have inserted the same BI chart view in a slide as a Flash object, increased the size of the object to 200% of its original size, and then take the screenshot:

Nice.
So, the next question is: why not have Flash charts in Excel too? क्यों? बोलो बोलो, कुछ तो बोलो! (
Kyon? bolo bolo, kuch to bolo!)

Well - here's the scoop. We did have Flash charts in Excel at one point during the development cycle. It's after all the same code that's calling the Presentation Server to get the Flash file for the selected chart view. And you could insert BI Chart views in Excel sheets as Flash objects. But feedback from people who tried it internally was that Flash charts in Excel are not easy to move around. Not BI Flash charts, but all Flash objects. It's almost impossible to even select them by clicking the Flash chart in Excel. Try it sometime - take a Flash chart from PowerPoint or any Flash file you can lay your hands on from anywhere else, copy it, and paste it inside an Excel sheet and then try to move it around. Also, there was the argument, philosophical in some sense, that Excel is more for displaying numbers and all, so let's leave the Flash charts for PowerPoint. Fair enough.

Let us know if you think otherwise - and if you would like Flash charts back in Excel (they never were there in the production release actually...). It’s (almost) as simple (I hope) as un-commenting back some code to enable the “Insert as Flash” back into Excel.

This is one example where we found that removing functionality can actually be a good thing and make the product better.

Monday, August 20, 2007

BI Office in 10.1.3.3 - Clipboard

What's this clipboard you keep talking about?

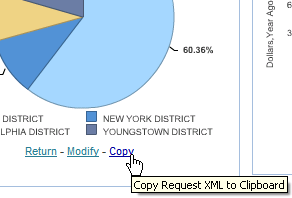
The clipboard (we don't really have an official name for it) lets you copy BI views from Answers or Dashboards and into Excel or PowerPoint using the BI Office Add-in as native Office charts or tables. It makes inserting BI content into Office documents simple as 1-2 (one-click to copy, one-click to paste).
The beginning:
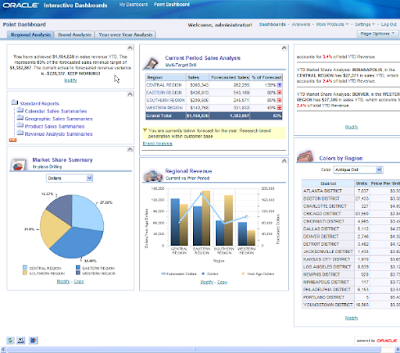
As a sort of history into the evolution of this feature, when we first started discussing it last year, we wanted to implement something different, a sort of a Windows independent clipboard. People would be able to copy a BI object into the clipboard from Answers or Dashboards, and then a user from Excel or PowerPoint would access that network based clipboard, and insert views. Some iterations later, after discussions between the development teams – the BI Office and the Presentation Services teams – we realized that we could do it in an easier and more user-friendly way. What if we simply copied, into the Windows clipboard, the fully qualified name and path to the BI view that you copied. That would read something like "#shared/Paint Demo/Sales Summaries/Regional Analysis/Regional Revenue|ChartView1" for a chart view named 'ChartView1' in request named "Regional Revenue" that was located under the Shared : Paint Demo : Sales Summaries : Regional Analysis folder path.. Since it was in your Windows clipboard, you wouldn’t need a separate component or product to manage its contents. That worked quite well. Till we started thinking some more. (yes, insightful thought is really a binary process... it can be off for stretches of time, and then when it switches on it can cause a lot of Eureka moments, and some of them with clothes on. Note to self: STOP with these non-sequiturs.) The thought was, wouldn’t it be really, really nice if we could allow users to copy a view in any state (as in let them copy when they are in California, Nevada, Karnataka, and so on). Huh? (Abhinav - these silly and infantile witticisms were cute the first hundred times, not any more!). Let me explain. Consider a Dashboard page. Let’s take the demo Dashboard page that ships with the product.


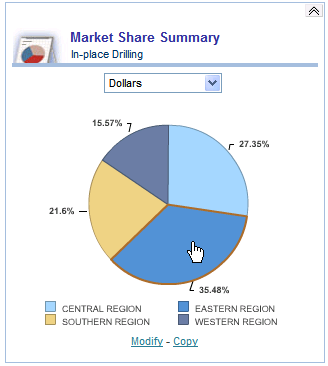
In-place drilling: Now, on this page I can do at least two different things as they relate to the BI clipboard functionality. Firstly, I can do an in-place drill into a view. Take this pie chart for example, that displays dollar sales by region:

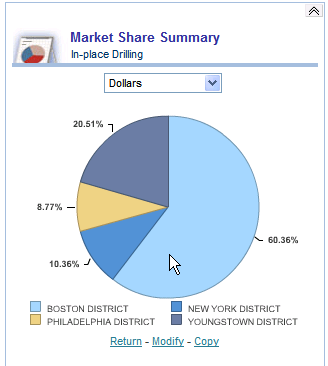
I can drill into the 'Eastern Region' so that it now displays the breakup of sales for the districts in the 'Eastern Region':

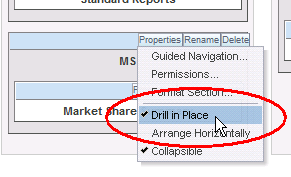
How to setup in-place drilling:
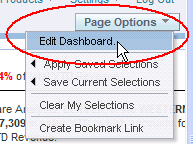
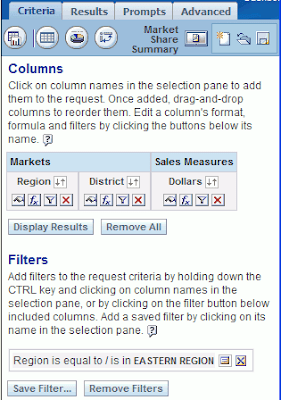
I got an in-pace drill here because that’s the way the chart has been setup in Dashboards. If you were to edit the dashboard, this is what you would see:


Copying the state of a view:
At this point, this chart has changed from its original definition.

While the original chart showed me dollar sales by region (the SQL would be: SELECT Markets.Region saw_0, "Sales Measures".Dollars saw_1 FROM Paint ORDER BY saw_0), (see below)


this drilled chart is showing me dollar sales for districts in the 'Eastern Region' (the SQL is: SELECT Markets.Region saw_0, "Markets"."District" saw_1, "Sales Measures".Dollars saw_2 FROM Paint WHERE "Markets"."Region" = 'EASTERN REGION' ORDER BY saw_0, saw_1).


If I were to have my BI clipboard working like it was designed initially, you would not be able to copy this modified view. What would get copied would be the original definition of the view. You would copy the chart and when pasted inside Excel or PowerPoint, it would be the chart with sales by region. Good, but not quite there, right? There’s got to be a better way. And indeed there is. What helped was the knowledge that the presentation services framework has a pretty good state management capability that the BI Office product and the clipboard could leverage. What do I mean? Well, consider this: when I click the 'print' link/button on a Dashboard page, the state of the Dashboard page is maintained and passed to the server that then generates a PDF or HTML version of the dashboard page, sans the header and other chrome that is unwanted in a printer-friendly version of the page. What the team then decided is, let’s copy the state of the chart into the clipboard. What I mean is, the chart in its current state – sales by district for 'Eastern' region – can be represented by appropriate XML that describes the chart, its format, as well as the metadata that it is displaying. Cool! What does it look like? It? The XML I mean.

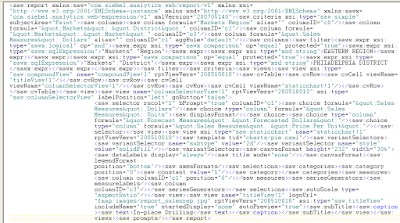
The XML


Ewww. That’s not nice. This is not fit even for a PG audience. But you asked for it, sir. The XML is not pretty, but at least you can scan through it to notice some things that the XML contains:

- the name of the subject area: 'Paint'
- the columns contained in the request (dollars, region, district)
- the filter (on region)
- the filter value: 'EASTERN REGION'
- all the views contained in the request - the compound view, the title view, the chart view, the column selector, etc...
- details about the chart view, including the sub-type (2D), the fill color, etc...

If you copy this view, and then paste it in Excel or PowerPoint using the BI Office Add-in's 'Paste' button, the BI Office ‘Paste’ button can turn this XML into something pretty in a jiffy, like this:


Ah. That’s good. I likes it.
What else can I do with the clipboard?
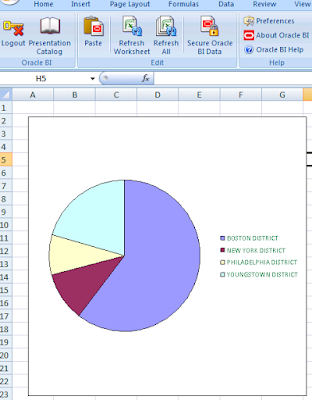
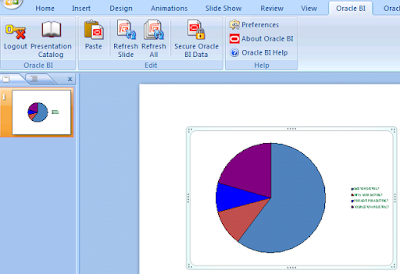
Well... let’s see. You can’t take it home to your mom. Nor can you take it out on a date. But you can go to PowerPoint and paste it there. The BI clipboard can take the same XML and turn it into beautiful Office charts in both Excel and PowerPoint. Let me correct that – it can turn XML into Office charts in both Excel and PowerPoint.

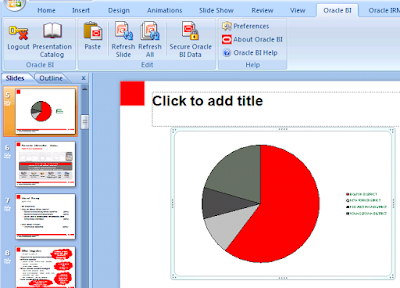
The chart above has inherited the color scheme of the PowerPoint template I am using.


The chart above has inherted the default color scheme as this is a new PowerPoint presentation.

Pasting a Table View
That’s all fine. A picture is worth a thousand words. But what if I wanted those actual thousand words? What if I wanted a table to be pasted into Excel? With many rows. Many, many rows, more than a thousand rows? Well... be my guest.
Take this longer-than-a-picture table with close to 1200 rows.


Copy it.


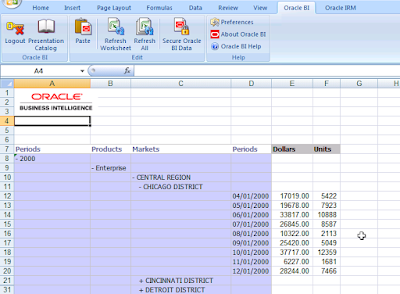
Go to Excel and paste it.


There you go.

Pasting a Pivot View

Not happy with a table? Prefer a Pivot View? No problem.
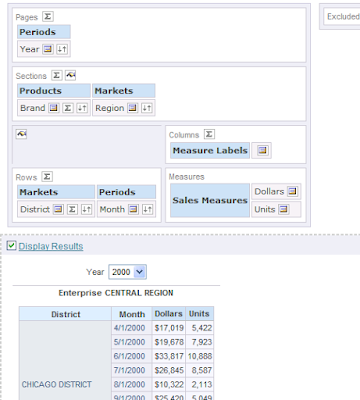
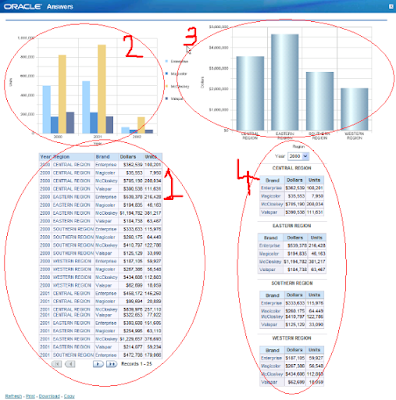
Here’s the Answers Pivot View.


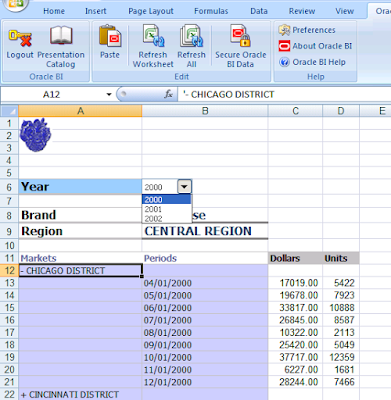
And here’s the pasted view pasted in Excel:


I see. Obviously, Abhinav, you are showing things that you had thought of. Yes sir, and that was quite an effort. But what about compound views? What if I had a table, and a chart, and another table, and a pivot view, and yet another chart, and .... yeah yeah yeah – I see you like compound views. Let’s take a case. Is this the sort of compound view you were referring to?


Yes. Ok. Sure.
No problem.
1 click to copy.
1 click to paste.


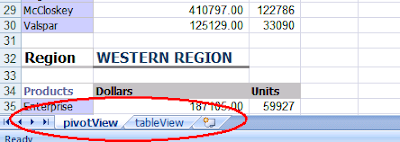
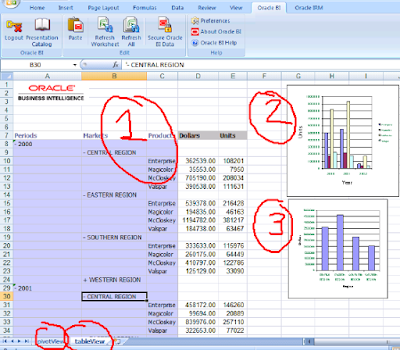
Each table view and pivot view is pasted onto a separate Excel sheet. The chart views can share the same sheet as a table or pivot view. Therefore, in this case, the four views from the request in Answers have been pasted onto two sheets in Excel.

But wait! I saw something there!!! What’s this?

That sir, is not a wardrobe malfunction (wouldn't that be embarassing?). It’s not even a clipboard malfunction. The honest fact of the matter is (you know I am upto no good when I preface a sentence with ‘to be perfectly honest’, ‘frankly speaking’) that we do not yet support all the views known to the Presentation Services. Therefore, we do not sneak around by not even telling you that these views have not been pasted.

Ok, ok, Mahatma Gandhi. But this may get on my nerves. Seeing this message everytime I paste a BI view that contains a title view.
I agree.
So are you going to do something about it??
Yes.
What?
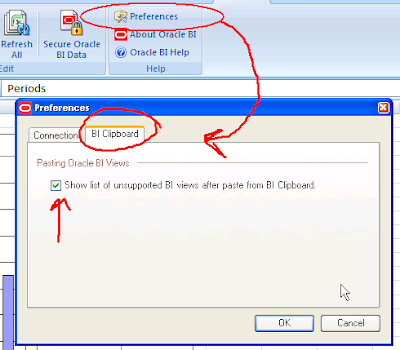
Go here:


Check this box, or uncheck it to not see the message about unsupported views.

And that marks the end of the post on the BI clipboard.
IOW, Elvis has left the building.