Pages

Thursday, May 25, 2006

Oracle leads in DBMS marketshare - IDC and Gartner studies

Two reports, one by IDC titled "IDC Reveals Steady Growth for Worldwide RDBMS Market as Top 5 Vendors Hold Their Positions" (link to news release), and the other by Gartner titled "Gartner Says Worldwide Relational Database Market Increased 8 Percent in 2005" (link to press release) state the same thing: Oracle continues to be the No.1 DBMS vendor but also exhibits the strongest dollar growth among all vendors.

This is an excerpt from the IDC report:
"There were no changes among the top 5 RDBMS vendors from 2004 to 2005, with Oracle capturing top honors with 44.6% of the worldwide market. Oracle was followed by IBM with 21.4% market share, and ranked third was Microsoft with 16.8% market share. Rounding out the top 5 were Sybase and NCR Teradata, with 3.5% and 2.9% market share, respectively. Microsoft experienced the strongest year-over-year growth on a percentage basis, and Oracle the strongest growth on a whole dollar basis in 2005."

The IDC report is titled "Worldwide RDBMS 2005 Vendor Shares: Preliminary Results for the Top 5 Vendors Show Continued Growth (IDC #201692)".

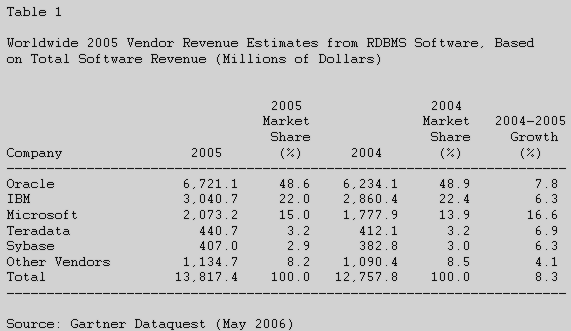
The Gartner report has this to say,
"Gartner Dataquest's Software research group has traditionally measured market share in terms of new license revenue. However, due to the emergence and increasing popularity of open-source software and buyer consumption models such as hosted and subscription offerings, Gartner has moved to measure market share in terms of total software revenue which includes revenue generated from new license, updates, subscriptions and hosting, technical support and maintenance. Professional services and hardware revenue are not included in total software revenue."

This is the table from the IDC news release:

And this is the screenshot from the IDC report (link to IDC report page - you need an IDC account to view the full report)

This is a screenshot from the Gartner report (link to report page - you need a Gartner account to read the full report):

Wednesday, May 24, 2006

Firefix the memory hog

Is there a memory leak? After spending most of the morning and afternoon using Firefox (for work related research mind you!) and opening and closing tens and tens of sites in new tabs, closing tabs, downloading documents, etc... the Firefox.exe process shows up as using in excess of 300MB of memory!! BTW I am running Firefox on a Windows 2000 SP4 machine.


Oracle Warehouse Builder 10gR2 (Paris) available for download

Though Oracle will launch the next release of Oracle Warehouse Builder 10gR2 (version 10.2.0.1, codenamed 'Paris') at the ODTUG Kaleidoscope 2006 conference, June 17-21 2006 (link) (also see my earlier posts on ODTUG 2006 - here and here), it is available for download from OTN today.

To download you can go to the OWB home page (link) on OTN (link)
It is not a small download, starting at 800MB for Windows, and topping out at 1.5GB for IBM AIX 5L

It has been certified on and is available on seven platforms initially; other platform support will follow.
  • Microsoft Windows (809,267,091 bytes)
  • Microsoft Windows (64-bit Itanium) (896,946,884 bytes)
  • Linux x86 (851,203,846 bytes)
  • Linux x86-64 (852,703,135 bytes)
  • Solaris Operating System (SPARC) (64-bit) (969,041,131 bytes)
  • HP-UX Itanium (1,164,365,076 bytes)
  • AIX5L (1,505,609,687 bytes)
See screenshot of the OTN home page today:

Tuesday, May 23, 2006

Great Data Mining blog post on DM SQL

Marcos has a great post on "The SQL of Analytics 1 - Data Mining" on the Oracle Data Mining blog (link to blog):

"What do we get when we combine the power of SQL with advanced analytics? The answer: a revolution. The Oracle RDBMS has added, over recent releases, support for advanced analytics to the SQL vocabulary..."

Simple Prediction Query
Question:
Select all customers who have a high propensity to attrite (> 80% chance)
SQL Query:
      SELECT A.cust_name, A.contact_info
FROM customers A
WHERE PREDICTION_PROBABILITY(tree_model, ‘attrite’
USING A.*) > 0.8


Follow this link for the full post.

Monday, May 22, 2006

Incremental fetch for graphs - totals only graphs

In my last post (Incremental Fetch for Graphs) I talked about how incremental data fetch for tables now works for graphs also. What I forgot to add was how this behavior works for totals only graphs.

In my graph options I now change my plotting option from "Data only" to "Totals only".

And I have two totals defined - one for each of my data points: Profit SUM and Sales SUM. These are grand totals, so that they will display only once at the end of the table.
And of course, I have my incremental fetch value set to 50 rows, so that when I run my worksheet it fetches only the first 50 rows of data. The graph does not display any... well.. graph... because the totals have not yet been displayed.
If I retrieve all rows into the worksheet, I get to see my totals at the end of the table, and the graph now shows a pie chart, with one slice for the Profit SUM total and the other slice for the Sales SUM total.

Friday, May 19, 2006

Incremental Fetch in Graphs

This is a small yet useful feature that was introduced in Discoverer 10.1.2 - for long tables where incremental fetches are performed for fetching data into Discoverer Plus, the graph now stays in synch with the table data.

The premise is straightforward - there is an option that allows the user to specify how many rows of data should be fetched in each increment. For long tables this helps in getting the data to the user quickly. The user always has the option of using the Tools --> Retrieve All Rows option to fetch all data into the worksheet.

Taking an example below, I have created a table with no page items (this is important, because when you specify page-items, performance benefits of incremental data fetch are lost), and specified that data should be retrieved in increments of 100 rows. My table will return more than a thousand rows of data, so this illustrates the concept nicely.

Notice in the screenshot below two things - only the first 100 rows of data have been fetched. There is a line at the end of the table that says "Click here to retrieve the next 100 rows.". The graph window similarly has a message that says "The graph currently shows only some of the available data. Select 'Retrieve All Rows' from Tools menu to show all of the data."
If you click the row at the end of the table, the next 100 rows are fetched, and the graph (bubble graph) updates to now show 200 data points.
And I can continue doing this till all rows of data are fetched into the worksheet. When no more rows of data are left to be fetched, the message no longer appears.


This is another example, but with a smaller dataset and a different graph type (area graph).


Discoverer Desktop had this capability in earlier versions also, but this was added to Plus in 10.1.2.


Wednesday, May 17, 2006

Discoverer presentations at ODTUG 2006 Kaleidoscope

Here are the Discoverer related presentations at ODTUG 2006 Kaleidoscope (link to my last post)
  • Oracle BI and PeopleSoft EPM by Mike Durran
  • The Art of Using Calculations Within Discoverer by Michael Armstrong-Smith, Armstrong-Smith Consulting
  • Rethinking OLAP: Simplicity Meets Power, and Both Win by Martin Gubar
There may be others where Discoverer may be shown or discussed... The BI Roadmap presentation by Christina for one will cover Discoverer and how it fits in with the different BI editons that Oracle announced - Standard Edition One, Standard Edition, and Enterprise Edition.

ODTUG Kaleidoscope 2006

ODTUG Kaleidoscope 2006 (link) is happening at the Wardman Park Mariott in Washington DC from June 17-21 next month (June is the next month after May... so that was a bit tautological).

To get a list of all BI presentations you have to see both the "BI Summit" and "BI/DW" options from the dropdown on the page (link to the ODTUG Kaleidoscope 2006 page, and link to the Schedule-at-a-glance PDF).

Some of the Oracle speakers are Keith Laker ("Climb to the OLAP Summit with Oracle Warehouse Builder 10gR2", "Reporting Against the Warehouse Builder Repository", and "Enabling Data Mining to Extend Your OLAP BI Solution"), Martin Gubar ("Rethinking OLAP: Simplicity Meets Power, and Both Win"), Ali el Kortobi ("What Exactly Is an Expert?"), Paul Narth ("An Overview of Oracle Warehouse Builder 10g Release 2 (Paris)", George Lumpkin and Ed Suen ("Business Intelligence Kickoff Keynote") - do not miss this, George Lumpkin ("Data Warehouse Architectures"), Christina Kolotouros ("Oracle Business Intelligence Road Map"), and more...

I shall not be attending (I just got back from a hectic one week trip to the US West and East coast, and the fact that I am up and awake at 2am shows either I work hard, and smart - as I would like to believe - or that I am jetlagged), but I hope some Oracle folks blog about it (Keith... are you listening? :-)
Mark Rittman shall be posting I am sure, as shall Michael Armstrong-Smith too I hope.

Market Share Analysis not rocket science

I have a post on portlets sitting in my drafts folder for over two weeks now - I need a couple of screenshots, so I hope to post it in the next day or two - but here is a news item about Oracle's President Charles Phillips statement about his being unable to "... get the financial analysts to (do market share analysis) anymore." that is likely to get lots of eyeballs (in part because it has been featured as a Google web clip on Gmail and as a "Blog quote of the day" in C|Net - link).


Ok - now I really have to post the portlets post soon, real soon...

Wednesday, May 10, 2006

Research Notes on Oracle BI

There are two articles in Intelligent Enterprise (link to site) by Ventana Research (link to VentanaResearch web site), one labelled a Ventana QuickTake™, and the other VentanaMonitor™, on Oracle's BI suite and strategy.

The first one, dated May 4 2006, (link to article) "BI Is Not Middleware", highlights, very briefly, a packaging issue that confronts Oracle. I.e., whether to position BI as part of the Fusion middleware suite, or whether to package and position it independently. Given the many surveys that indicate that spending on BI solutions is the highest priority for many companies, the argument seems to be in favor of packaging BI independently...

The second one, dated May 8 2006, (link to article), "Oracle Re-Enters BI Market Seeking Leadership Position", briefly describes Oracle's BI announcement in March (link to previous blog post) and the product suite, and then follows with an assessment of the challenges facing Oracle in establishing itself as a leading BI tools vendor. The tone of the article is neutral, and the last paragraph sums up the situation:
"Oracle is an embryonic stage in its adoption of BI as a strategic component of the overall business. Nonetheless, this could become a significant element of its business and deliver sophisticated technology for enabling companies to manage their performance."

And, finally, on a slightly different note, Mark Rittman (link to blog) has posted a detailed introduction to the Enterprise Edition of Oracle Business Intelligence (see post, "An Guide to OracleBI Suite Enterprise Edition").

Correction: I hit the wrong combination of keystrokes and the post published prematurely. Completed a sentence that had been left dangling.

Thursday, May 04, 2006

In the US next week

This is (also) not a BI post in any way - stop reading if you are not interested.

I shall be in the US next week, first to Oracle's headquarters at Redwood Shores, then a short one day halt at Burlington, MA, and then back to India. I shall also get to meet at least some of the Siebel Analytic people there (I met a few here in Bangalore a couple of weeks back). Don't know how much I shall be able to blog, but I shall certainly take lots of photos to post when I am back.

The thing that struck me is that I shall be spending almost as much if not more time travelling as I shall at work there. Consider this:
BLR - FRA: 9:40 (that would mean 9 hours and 40 minutes, and BLR stands for Bangalore, FRA for Frankfurt, SFO for San Francisco, BOS for Boston, and MAD for Chennai)
Halt at FRA: 2 hours
FRA - SFO: 11:10
SFO - BOS: 5:30
BOS - FRA: 7:05
Halt at FRA: 5:50
FRA - MAD: 8:45
Halt at MAD: 6:35
MAD - BLR: 0:45

That is a grand total of 57 hours and 20 minutes of flying and waiting at airports, about 30,000 kms, all over the course of a little over 8 days, and all in the uncomparable luxury of economy class (mind you this is still better than flying between Milwaukee and Seattle every week, or between Tampa and Seattle that I did a few years back for the better part of the year). At least it is better than the standing room future that Airbus has been supposedly pitching to Asian airlines (read the story and the subsequent denial). Looking at this photo and this one, I shouldn't really be complaining though; there are more 'compressed' ways of commuting.

Day and a half versus an hour and ten minutes

This is not a business intelligence post, but this is still such a nice article on a customer success story that I had to blog this.
ComputerWorld details a case study (link) where a customer, NextAction, moved from SQL Server to Oracle Database 10g and saw some dramatic improvements. The full article is worth a read, but here are some interesting snippets (bold formatting is mine):

In 2004, the company’s 13TB data warehouse was spread across five Microsoft SQL Server 2000 databases. But within a year, the fast-growing firm’s database had grown to 30TB spread across eight instances of SQL Server 2000.

Microsoft treated Helle well, putting NextAction into a special program for extremely large databases that included plenty of support. But within two weeks, the results were clear to Helle. “SQL Server has made great strides in the past couple of years. But like I told the Microsoft guys, it’s hard to match [Oracle’s] 15 years of evolution,” he said.

An updating statement that died after 1.5 days on SQL Server without completing took one hour and 10 minutes to finish on Oracle.

That 30TB database was shrunk to just 5TB after being rewritten -- and it was moved to one Oracle instance from eight.

Great Analysis Article on Oracle BI From Bloor Research

There is a very positive article on Oracle's BI product strategy announcement (link to video on Oracle.com) titled "Oracle set to become probably the most important player in the BI market" (link to article), written by David Norris (link to profile page), Associate Analyst with Bloor Research.

Some snippets from the article:
"...after the acquisition of Siebel, Oracle have started to merge their product lines, and the resultant solution set is very exciting."

"With the acquisition of Siebel Oracle find themselves as the owners of one of the most exciting BI solutions available at present."

"...Oracle is taking BI very seriously, and this new found enthusiasm is being backed by significant investment and the creation of a very complete vision to enable them to compete very aggressively in all segments of the market."

What's there to not like in this article?

Also see my earlier posts on the topic:
  1. Oracle's BI Strategy Briefing
  2. More on Oracle BI and Siebel Analytics
  3. Siebel Analytics and the Oracle acquisition

Wednesday, May 03, 2006

Graph displayed data in Viewer

This is a little known feature in Discoverer Viewer, and was introduced in Discoverer 10.1.2. I think it is one of those wonderful little features that probably few people know about, but can be immensely useful.

Take for example the table below. It displays Profit and Margin data for Cities, Year, and Quarter, by Region. For the given dataset this query returns 70 rows. Even though I have 25 rows of data displayed the bar graph shown below is plotting data for all 70 rows.


As you can see the graph looks crowded. I could change it to an area graph or a line graph to improve its appearance, or I could increase the plot area of the graph, but there is a third alternative.
First, I want to reduce the number of rows of data I see in my table itself. Since I have 10 quarters worth of data for every city, I have set the number of rows I want to see at a time to 10.


The second, and more important change I make is this: expand the 'Tools' toolbar of the graph, and you will notice two radio group options. The first one, 'All data', is the default option. The second option, 'Displayed data', is what I am interested in. I check this option and click 'Go'.
The graph now plots data only for those rows that are actually displayed in the table in Viewer, not for all the data.


If I were to page to the next 10 rows of data in the table above, the subset of data graphed changes from 'Chicago' to 'Cincinnati'.

Nice, isn't it?

A brief footnote: sometime in July 2003 our Viewer expert had prototyped this and asked for inputs on the suitablity of including this in the final product. My feedback was, "I think it is great!"