Pages

Wednesday, November 25, 2009

Visualizations - The Pie Chart

The Telecom Regulatory Authority of India (TRAI) put up a press release, Date: November 21, 2009 Press Release:Telecom subscribers growth for the month of October 2009. ,  that has information on the telecom subscription data in India for the month of October 2009. Apart from the quite amazing piece of news that India added 16.67 million (that is 16,670,000) new wireless subscribers, and that the total telephone subscriber base now stands at 525.65 million (that is more than half a billion), the notable thing as far as this blog post is concerned is that depressing use of visualizations in the note.


A few things are obvious at first glance:
- It is a pie chart with a 3D effect.
- This is an Excel generated chart.
- There is redundancy in the chart: the slice labels contain the operator name, and then the legend at the bottom repeats the same information.
- The data is not sorted, so even if you could somehow compare these 3D slices, you would have a tough time finding which is the largest slice, which is the second largest slice, and so on.
- To find the largest slice, you are better off simply comparing the numbers. Which makes the chart itself quite unnecessary.
- The color scheme is very Excel-ish, which is to say, quite unpleasing to the eye. Excel 2007 is an improvement, for sure.
- There are black borders around the slices, which do not make the chart any better.
How to improve this?
Here are some examples:

Example 1:
You cannot really go wrong with a bar chart. This bar chart displays the same data, except now as a bar chart. Straight off you can tell from a visual inspection that "Tata" added the most subscribers, close to 25% of the net additions in October 2009.


Example 2:
I have now added data labels at the top of each bar. This makes it possible to see the precise values for each operator.


Example 3:
By now, it is clear that sorting the bars would make the data a lot more easily digestable. So what insights are now possible with this example? For one, that Reliance and Aircel and even Idea are two operators that added almost the same number of subscribers. Not very obvious from the above examples. Aircel is a relatively new operator, but seems to be growing quite fast, thanks to its aggressive advertising.


Second Chart:


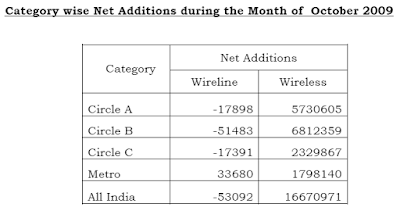
This table above shows "Category wise Net Additions during the Month of October 2009'.
Notwithstanding the fact that the data here would be a lot more easy to understand if it had been formatted with commas, let us see how it may be visualized as a chart:

This chart does one thing well. It gives a sense of the difference in scale between the wireline and wireless segments. The wireless segment is growing by millions, in every circle, while the wireline segment is in decline. The decline is however minuscule. And without labels, it is difficult to gauge even the approximate values.

So, if I plot this now as a percent stacked bar chart, it looks like an improvement. What I have done is added labels to each stack. I can now see that the Metro segment showed a rise, while the other three segments showed a decline in the wireless segments.
However, this chart is sort of misleading, because it makes the wireline and wireless segments appear equal. Which, as we saw, is most certainly not the case.


As the third example, I have now plotted the same data as a stacked vertical bar chart. Not as a percent stacked chart, but simply taken the absolute values and stacked them.

The vertical chart brings out quite nicely the difference in magnitude between the wireline and wireless segments.
A problem existed for this chart also. Which is that the categories for the wireline segment are so small, that the individual stacks are barely visible, even on a chart as tall as this one. So, I have added data labels, and then manually moved the labels so that they don't overlap.

Friday, November 20, 2009

Deploying OBIEE on Sun

This post is not exactly fresh on the heels of Oracle OpenWorld (OOW), but one presentation of note was OBIEE in a High Availability (HA) environment.

The document DEPLOYING ORACLE® BUSINESS INTELLIGENCE ENTERPRISE EDITION
ON SUN SYSTEMS
was instrumental in getting to HA.

Enterprise Deployment of Oracle BI EE on OC4J and App Servers

There have been questions in regards to OC4J vs a "full" Application Server when in use with Oracle Business Intelligence Enterprise Edition.

To be clear OC4J is very capable J2EE engine. It is used as the J2EE runtime component of Oracle Application Server. However, when it comes to enterprise deployments the System Management, features, and functionality of the "full" Application Servers provide some benefits that the following document discusses.

OTN:
Enterprise Deployment of Oracle BI EE on OC4J and App Servers

My Oracle Support:
Note: 968223.1 - Enterprise Deployment of Oracle BI EE on OC4J and App Servers

Wednesday, November 18, 2009

Applied Oracle Security: OBIEE

Hi There!

It has been a while since I have posted.

As part of your required reading take a look at Applied Oracle Security

This book contains two chapters and an appendix on OBIEE security:
-Chapter 13. Securing Access to Oracle BI
-Chapter 14. Securing Oracle BI Content and Data
-Appendix A. Using the Oracle BI Examples

Friday, July 03, 2009

Junk Viz - Web Searches

Search Engine Land has a post, Michael Jackson’s Death: An Inside Look At How Google, Yahoo, & Bing Handled An Extraordinary Day In Search, on how web traffic spiked at some of the web's leading properties like Google, Facebook, and Wikipedia, as a result of Michael Jackson's death.

All good and fine, and a sad day for fans of Michael Jackson, the king of pop as he was known as, but a sad day also for data visualizations.
The chart above is a time-series area graph, and you can see that on the 25th of June 2009, around 14:00 hours traffic to Google querying "Michael Jackson" or combination of words thereof, began to spike. But by how much? Where is the scale? What does each increment of the gridline indicate? 1 million searches? 10 million searches? 100 searches?
Secondly, the area chart could instead have been replaced with a line graph, thus minimizing non-data pixels.

The bar chart above does a better job, in that you can actually see what the vertical scale represents. However, there are at least three problems with this chart:
  1. The color scheme makes it tough to see the data clearly. Of course there are only two bars, so it is not that difficult.
  2. The X-axis labels are gibberish. There is no sub-title or explanation of what these numbers mean. What does "6.4k" mean? And what do the zeros at the end signify?
  3. The location of the vertical scale on the right is non-standard. Most often a scale is placed on the right edge when there are two axes on the graph, as in a dual-Y bar/line graph, and the left and right edges both have different scales. For example, if you were plotting sales and units on the same chart, and using the left axis for the sales and the right axis for the units data.
  4. Adding a fourth quibble: time series data is best visualized by a line graph.


A better graph than the first one, but with the same problems of having no vertical scale.

Downloading Discoverer 11g

Go to http://www.oracle.com/technology/software/products/middleware/htdocs/111110_fmw.html and accept the license.


Browse down to the section that says "Portal, Forms, Reports and Discoverer". 
Currently there are downloads available for Windows and Linux:


 As you would expect, this download contains the familiar set of components; I have highlighted in bold the ones that are relevant for Discoverer:


  • HTTP Server
  • WebCache
  • Forms Services
  • Forms Builder
  • Reports Services
  • Report Builder/Compiler
  • Discoverer Administrator
  • Discoverer Plus
  • Discoverer Viewer
  • Discoverer Services
  • Discoverer Desktop
  • Enterprise Manager Fusion Middleware Control
 Now, unlike the previous release of Discoverer, 10g, where you could install the standalone version of Discoverer and be up and running, here you need a few more components in order to be able to install Discoverer, and these need to be installed in a specific order.

  • WebLogic Server
  • Repository Creation Utility
  • Identity Management
  • SSO Metadata Repository Creation Assistant
  • Identity Management 10gR3
  • Oracle Database
WebLogic Server is easy enough to understand: it, or WLS as it is commonly referred to as, is the app server that is front and center in Oracle's middleware suite.
Repository Creation Utility, or RCU as it is sometimes referred to, is used to create your repository on the target database.

SSO Metadata Repository Creation Assistant is optional for Discoverer - if you do not intend configuring Discoverer to run under Single Sign-On, then skip this.

An Oracle Database 11g, Enterprise Edition, is what the last item refers to, and this is where the Discoverer repository is created by the RCU. Similar to the "Infrastructure" database in 10g.

Have fun downloading, and patience too, as these are downloads totaling several gigabytes.

More later.

Thursday, July 02, 2009

Discoverer 11g Doc

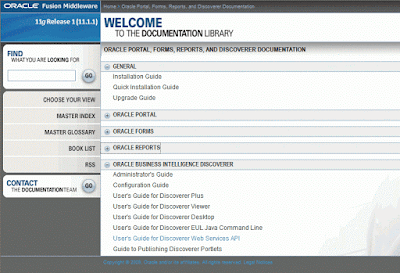
screenshot of Discoverer 11g doc page
If you see the Discoverer 11g Documentation library at http://download.oracle.com/docs/cd/E12839_01/pfrd.htm, you will notice the familiar set of docs, with one new addition. There is now a doc for the Discoverer Web Services. The "Oracle® Fusion Middleware User's Guide for Oracle Business Intelligence Discoverer Web Services API", 11g Release 1 (11.1.1), Part Number E10412-01 can be viewed at http://download.oracle.com/docs/cd/E12839_01/bi.1111/e10412/toc.htm, or downloaded as a PDF from http://download.oracle.com/docs/cd/E12839_01/bi.1111/e10412.pdf

As a brief intro, these web services are a layer of SOAP based web services that sit on top of Discoverer, provide access to a variety of functions, and provide a level of abstraction from the underlying implementation of the functionality that these services expose.

The very first instance where these web services were used was in the integration between BI Publisher and Discoverer (see my posts on this topic from 2007), that happened with the BI Publisher 10.1.3.3.0 release and Discoverer 10.1.2.2 release in 2007. Actually, there was a one-off patch that had to be applied on top of Discoverer 10.1.2.2 which contained the web services libraries. However, these web services were not yet meant to be consumed externally by customers for building their custom integrations. The intent was to document these and release them with the Discoverer 11g release. There is a slightly fascinating history behind the evolution of this project that I will try and blog about in a future post.

The other place where these web services shall be used is in the integration of Discoverer with the Oracle Business Intelligence Suite Enterprise Edition Plus, also referred to sometimes as simply OBIEE. Specifically, and since this is about functionality not yet released, please bear in mind that some or all of this could change, so do not take this as official Oracle communication, the intent is to use these Discoverer web services to publish Discoverer worksheets to an OBIEE Dashboard page, and to also use these same web services to allow OBIEE Delivers to run and send Discoverer worksheets on a scheduled basis.

More later.

Wednesday, July 01, 2009

Oracle FMW 11g


Use this link - http://www.oracle.com/features/hp/oracle-fusion-middleware-11g-launch.html - to register for the event.

Apart from the very important reason that Fusion Middleware is the technology platform and foundation of Fusion Applications, Fusion Middleware 11g is also the vehicle for the release of Discoverer 11g.

Tuesday, June 30, 2009

Junk Viz Examples

I have obtained all three examples from Paul Kedrosky's blog, Infectious Greed.


© 2009, Abhinav Agarwal. All rights reserved.

Wednesday, June 24, 2009

Junk Viz Example


Getting people to think is a good thing. However, getting them to think that your ad has a chart that just does not make sense is not a good thing.

The more people see this chart, if you can call it a chart, the more they will have questions.
  • Who are these so called 'Other Guys'? Is Google Gmail one of them? Is Hotmail there? What about the great local email provider from my country?
  • These features are not listed in an alphabetic order. Does that mean something?
  • Is Tab View the most important feature? Is it the least important? Do the other features listed on the Y-axis build upon the Tab View?
  • Does it mean that none of the vendors, 'The Other Guys', offer 'Chat', or 'Unlimited Storage'? Their bars do not go up that high.
  • Are these the only features to look for in an online email service? I don't see an entry for 'Calendar'. Surely that's important.
  • Why not include other useful features like Labels, Threaded conversations view, Integrated Calendar, Post to Blog s, Facebook / Twitter integration, Rich text editor , Missing Attachment Detector, Address Suggestion, Integrated attachment viewer , Mobile support, SMS integration, and so on... ?
This chart just does not make sense.
A shining example of a junk chart.

A simpler and obvious way of showing such a comparison would be to simply use a table:
or

This at least gives a more honest picture of the features that the 'Other Guys' have and don't have.

Cartoony charts that serve no other purpose than to convey an illusion of geekiness should be avoided. Who anyway compares email providers today? Don't most people today have accounts on two or more of Hotmail, Yahoo Mail, Google Mail, Rediffmail, IndiaTimes mail, AOL, etc... ?

In the world of Web 2.0 you create a buzz for your products through netizens, who blog, twitter, digg, and post on Facebook, Orkut, MySpace about your products.

© 2009, Abhinav Agarwal. All rights reserved.

Monday, June 22, 2009

Junk Viz Example


An article, "Home loan rates go down", from SiliconIndia, posted on Monday June 22 2009, has a small graphic on the left of the article. It is a good example of a junk visualization. It cannot even be called an example of a junk chart since there is no data at all. It only shows a pseudo-3D chart with small houses perched on top of each bar, and with a line arrow trending downwards, to ostensibly signify that something is going down. To make things worse, there is a reflection effect added.
Not good.

Tuesday, April 28, 2009

BI EE 10.1.3.4.1, DAC, and BI Apps 7.9.6 Now Available

Oracle Business Intelligence Suite, Enterprise Edition, version 10.1.3.4.1, is now available for download from the Oracle Technology Network.

BI EE Software Download:
The download page is http://www.oracle.com/technology/software/products/ias/htdocs/101320bi.html and the download links for the different platforms are:
and the download includes the following products:
  • Business Intelligence Suite Enterprise Edition Plus
  • Business Intelligence Suite Enterprise Edition Plus Upgrade
  • Business Intelligence Disconnected
  • Business Intelligence Server Administrator
  • Business Intelligence Server Enterprise Edition
  • Option: Answers
  • Option: Delivers
  • Option: Interactive Dashboard
  • Option: Office Plug-in
  • Option: Reporting and Publishing (This is the same as Oracle BI Publisher, v 10.1.3.4.1)
  • OC4J Standalone zip file
The size of the download is a 1.5GB.

Oracle BI Publisher:
While Oracle BI Publisher is available with the BI EE suite download, it is also available as a standalone download also on the same page.
Oracle BI Applications 7.9.6:
There is a single download 320MB file for all platforms, downloadable from http://download.oracle.com/otn/nt/bi/biapps_windows_796.zip
Be sure to read the Oracle Business Intelligence Applications Licensing and Packaging Guide version 7.9.6 for details on the licensing and packaging of these applications.
And what BI Applications are included with this release? A truckload!
  • Case Management Analytics Fusion Edition
  • Consumer Goods Trade Funds Analytics Fusion Edition
  • Contact Center Telephony Analytics Fusion Edition
  • Finance Institutional Analytics Fusion Edition
  • Finance Marketing Analytics Fusion Edition
  • Finance Retail Analytics Fusion Edition
  • Finance Sales Analytics Fusion Edition
  • Finance Service Analytics Fusion Edition
  • Financial Services Profitability Analytics
  • Financial Analytics (Commercial) Fusion Edition
  • Financial Analytics (US Federal Financials) Fusion Edition
  • Human Resources Analytics Fusion Edition
  • Insurance Marketing Analytics Fusion Edition
  • Insurance Partner Manager Analytics Fusion Edition
  • Insurance Sales Analytics Fusion Edition
  • Insurance Service Analytics Fuision Edition
  • Loyalty Analytics Fusion Edition
  • Marketing Analytics Fusion Edition
  • Partner Analytics Fusion Edition
  • Pharma Marketing Analytics Fusion Edition
  • Pharma Sales Analytics Fusion Edition
  • Price Analytics Fusion Edition
  • Procurement and Spend Analytics Fusion Edition
  • Project Analytics Fusion Edition
  • Sales Analytics Fusion Edition
  • Service Analytics Fusion Edition
  • Supply Chain and Order Management Analytics Fusion Edition
  • Telecom Marketing Analytics Fusion Edition
  • Telecom Sales Analytics Fusion Edition
  • Telecom Service Analytics Fusion Edition
Oracle Business Intelligence Data Warehouse Administration Console
What does this contain? "Technology platform for managing and deploying ETL processes for Oracle Business Intelligence Applications. Features include metadata-driven ETL design, intuitive interface for ETL configuration and customization, and optimized execution engine with monitoring capabilities."
Download the 181MB downloadable for Microsoft Windows from http://download.oracle.com/otn/nt/ias/101341/dac_windows_x86_101341.zip, while the Red Hat Linux / Oracle Enterprise Linux version can be downloaded from http://download.oracle.com/otn/linux/ias/101341/dac_linux_x86_101341.zip

Documentation:
The doc page for BI EE is http://www.oracle.com/technology/documentation/bi_ee.html
And you can view the documentation library for the 10.1.3.4.1 release at http://download.oracle.com/docs/cd/E10415_01/welcome.html or download the 22.5MB zip file containing the entire doc library from http://download.oracle.com/docs/cds/E10415_01.zip

The New Features doc is available at http://download.oracle.com/docs/cd/E10415_01/doc/bi.1013/e10416/toc.htm, while the SR & SP (System Requirements and Supported Platforms) guide can be downloaded from http://download.oracle.com/docs/cd/E10415_01/doc/bi.1013/e10417.pdf

The documentation page for BI Applications is http://www.oracle.com/technology/documentation/bi_apps.html
You can download the doc library from http://download.oracle.com/docs/cds/E14223_01.zip or view the library online at http://download.oracle.com/docs/cd/E14223_01/index.htm
The Release Notes are available at http://download.oracle.com/docs/cd/E14223_01/bia.796/e14222/toc.htm while the System Requirements and Supported Platforms doc is available online at http://download.oracle.com/docs/cd/E14223_01/bia.796/e14221.pdf