Pages

Showing posts with label Open World. Show all posts

Friday, October 14, 2011

OpenWorld Database General Session and Exalytics

The Oracle Exalytics Business Intelligence Machine (White Paper), announced at the recently concluded Oracle OpenWorld conference in San Francisco, was also featured in Andy Mendelsohn's (Senior Vice President, Oracle Database Server Technologies) Database General Session. This is also the session where Andy Mendelsohn showcased the Oracle Big Data Appliance, "an engineered system optimized for acquiring, organizing and loading unstructured data into Oracle Database 11g.".

Also see my previous posts:
Here are screenshots from the Database session:


Do take a minute to read this disclaimer, since this pertains to future functionality.


The software consists of the Oracle TimesTen In-Memory Database, the secret-sauce, so to say, that enables the in-memory capabilities of Exalytics. TimesTen is the market leading in-memory database solution. Exalytics is also tightly integrated with and can connect to an Oracle Exadata machine via Infiniband. The software foundation, of course, is the market leading analytics suite, Oracle Business Intelligence Foundation Suite (informally known as OBIEE).

40 Intel processor cores, 1TB RAM, and an ultra high-speed 40Gb Infiniband connection to Oracle Exadata.


This is Jacques Vigeant, currently my manager, demonstrating Exalytics in the session. Ultra industrial-scale Master-detail linking is just one of the ingredients here. Another of the features I wrote about and defined as a product manager. Others being advanced data visualizations, and mobile analytics. Feels good :-)


Geo-spatial visualizations in the Exalytics demo. Zoom into the Map View. This particular example shows store locations in the city of San Francisco. The map data has been provided by NAVTEQ.


You can add or remove formats from the Map View, with a mouse-click. Color-code by quartiles, quintiles, deciles, or any other arbitrary number of bins. Select from percentile binning, value binning, or even continuous fill bins. Choose variable shaped markers, or pie graph or bar graph overlays. Even use images as markers.

Monday, August 27, 2007

OOW 2007 News

Oracle OpenWorld 2007 (San Francisco, Nov 11-15) is just a couple of months away.

The Session Tracks | Oracle OpenWorld 2007 page lists four tracks:
and you can view a listing of all the tracks and content at this page: Oracle OpenWorld - Content Catalog

Some sessions pertinent to BI:For those interested in the Discoverer to BI EE migration, this is a session you must attend:
How-to: Migrating an Oracle Discoverer System to Oracle Business Intelligence Enterprise Edition - Mike Durran, Oracle

and two by yours truly:
In case you are interested in the new OLAP capabilities in Oracle Database 11g, especially as they relate to materialized views (MVs), this is the session for you:
Enhanced Business Intelligence and Data Warehousing with Oracle OLAP 11g - William Endress, Oracle
Early bird registrations close on September 14 (Register now)

Michael informs us at his blog that he shall be presenting a paper - Paper accepted at Open World 2007 - Build an EUL in One Hour is the official name of the session.
Mark Rittman also has a paper on BI and SOA (Open World, BIWA, UKOUG and Oracle Mag) - Integrating Oracle Business Intelligence Enterprise Edition and SOA: Step by Step is the official name of the track.

I shall, hopefully, have more posts on the conference over the next couple of months.

Thursday, September 14, 2006

X-Treme at Oracle OpenWorld

X-Treme Program at Oracle OpenWorld 2006Keith and I have blogged about the upcoming Oracle OpenWorld conference (link to page on Oracle.com) in San Francisco next month (Oct 22-26 2006).
This year, the X-Treme program (link) offers highly technical, deep-dive content through a series of intense breakout sessions and X-Treme hands-on workshops. It covers twelve tracks on various topics including business intelligence. The BI track (link) shall cover Oracle BI Suite Enterprise Edition (link to product page on OTN). There, "you will learn how to use the components of Oracle BI EE, including Oracle BI Answers, BI Dashboards, BI Advanced Reporting, BI Delivers, and BI Server Administration. Join us for deep-dive BI hands-on workshops that you won't find on the regular OpenWorld agenda."

This is an awesome way to learn more about the products and meet the people behind the products (except me, I shall not be attending OpenWorld this year big grin). You get to meet the product experts, and get to hear from them about the current product release, upcoming releases, roadmap, and more. Of course there are many regular conference sessions, presentations, and keynotes that shall cover this, but at the X-Treme program you get to meet the product experts even before the conference begins (remember, the X-Treme session starts on Oct 21 and end the next day on Sunday, Oct 22).

Click on the banner above or click this link to learn more about and register for X-Treme.
Here is a link to all the special programs on offer at this year's OpenWorld.

Tuesday, August 01, 2006

BI/DW Training at OpenWorld 2006


The Oracle OpenWorld conference is being held, as usual, in San Francisco from Oct 22-26. This year's conference is shaping up to be a very big event with even more activities than last year.

As always there will be hands-on labs. However, this year they have all been brought together under the banner of "XTreme Weekend". This year the labs will be a lot more intense than in previous years and are intended to give delegates as much hands-on time as possible. For example for Warehouse Builder we will be providing a whole day of exercises that work through many of the new features we have added to 10g Release 2. For users more interested in reporting, this will be an excellent opportunity to get some quality time with the new BI Enterprise Edition suite of products. Full details of both tracks are below.

The labs will be staffed by product management, developers, and experienced sales consultants. So this is a great opportunity to get free advice and guidance as well as learn about the products. There will be two BI/DW tracks spread over two days (Saturday 21 and Sunday 22). There are only 75 seats available for each track and both tracks are filling up very rapidly and registration is on a first come, first served basis. Register today to attend the X-Treme program to avoid disappointment
  • Oracle OpenWorld attendees: Register now for the X-Treme Weekend program for the discounted rate of $650. Register now.
  • Non-Oracle OpenWorld attendees: $950. Register now.

The full details of the two BI/DW tracks are as follows:

The Leading, End-to-end Data-Warehousing Platform with Enterprise ETL, OLAP, and Data Mining Capabilities
The Oracle Database is the best platform for supporting your business intelligence applications. Oracle provides an industry leading ETL (extract, transform, and load) tool, deeply integrated OLAP capabilities, and sophisticated data mining capabilities. Join us for deep-dive BI and DW hands-on workshops that you won't find on the regular OpenWorld agenda. Here you'll learn directly from Oracle experts in the following areas:
  • How to design, deploy, and manage a feature rich data warehouse environment using Oracle Warehouse Builder
  • How to deliver rapid query-response times and sophisticated analysis with Oracle OLAP
  • How to incorporate predictive analytics and advanced data-mining techniques into your business intelligence infrastructure with Oracle Data Mining
Designed for administrators, data architects and database developers of data-warehouse and business-intelligence systems, you will have hands-on experience across all of the key database capabilities for delivering business intelligence.


Next Generation Business Intelligence for Actionable Insight to Everyone in the Enterprise
In this session, you will learn how end users can construct their own queries and build their own dashboards using Oracle BI Suite Enterprise Edition. Oracle BI Suite EE lets you empower employees at all levels with the information they need to make better business decisions easily and efficiently by creating reports, charts, and performance management dashboards through drag-and-drop interface in a completely self-service, Web-based environment. Oracle BI Suite EE lets you collaborate and share business insight through email, and schedule and deliver your reports to dashboards or even wireless devices. You will also have hands-on experience in administrative tasks for defining the physical, logical, and presentation layers to define how end users will interact with the data using business terms. In this hands-on lab, you will learn how to use the components of Oracle BI EE, including Oracle BI Answers, BI Dashboards, BI Advanced Reporting, BI Delivers, and BI Server Administration. Join us for deep-dive BI hands-on workshops that you won't find on the regular OpenWorld agenda.

For a list of all the XTreme Weekend tracks (Database, Fusion Middleware, Apps) click here to go to the Oracle OpenWorld XTreme Weekend site.

Thursday, January 19, 2006

Webcast URL for Open World Mumbai 2006

I am back in office after Oracle Open World at Mumbai last week (link to Open World Mumbai page on Oracle.com). Catching up on a few hundred emails. I shall write up a couple of posts on the Open World experience later this week, though I spent almost all of OOW at the demogrounds, spending 6-7 hours each day at the Discoverer and BI booths.

I also plan on watching recordings of some of the keynotes - which are available on Oracle.com here (link to the keynotes video page)

One of the highlights for the Oracle employees at the demogrounds (called 360 degree exhibits) was the visit by Charles Philips (along with Derek Williams, Mark Gibbs, Krishan Dhawan and others) to the demogrounds. He stopped by the Business Intelligence booth and briefly saw the integrated BI demo. At that time I was busy at the Discoverer pod with a number of visitors, so this lone photo is all I could manage.
The person in the foreground with his face turned away is Rajesh Gadodia, while the person hidden behind him in the white t-shirt is Balaji Krishnan. And the tallest person in the photo is Charles Philips.

Wednesday, January 04, 2006

Open World Mumbi 2004 - Vignettes

The last Open World held in Mumbi was in November 2004. This is the link to the 2004 Open World site, and you can download presentations from the conference here (link to presentations download page).
Sudip Majumder and I had two presentations on BI in 2004.
  • Abhinav Agarwal - Mangement Dashboards for Business Intelligence (link to PDF file)
  • Sudip Majumder - Oracle 10g Integrated Business Intelligence Solutions (link to PDF file)
This year's OOW in Mumbai is being held at the same venue - the NCPA in Nariman Point. If you visit the NCPA's web site (link to web site) this is how it describes itself:
"... stands on the southern tip of Mumbai’s Marine Drive promenade, The National Centre for the Performing Arts, is India’s premier socio-cultural centre and perhaps the only one of its kind in Asia. "

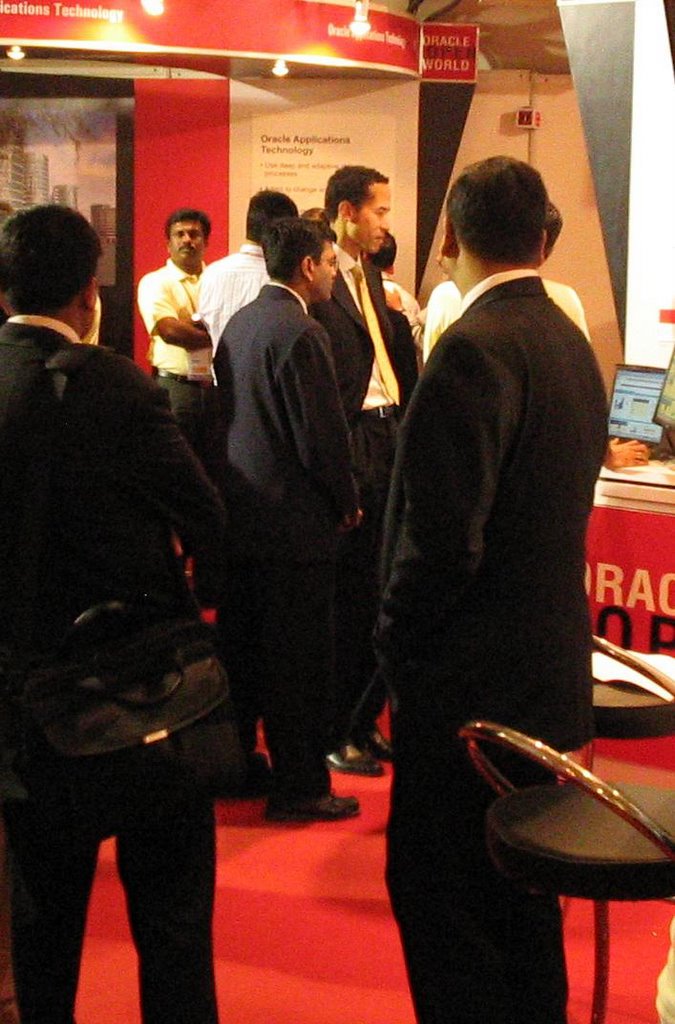
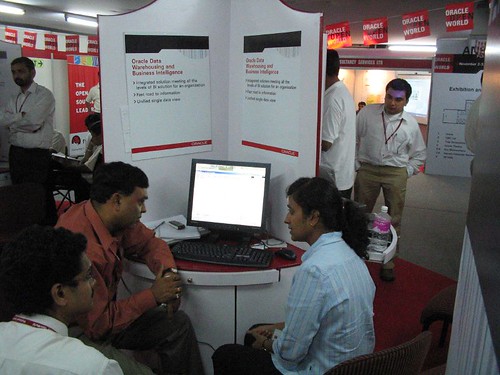
I shall post photos of NCPA next week, but in the meantime here are some photos from the 2004 Open World, Mumbai.

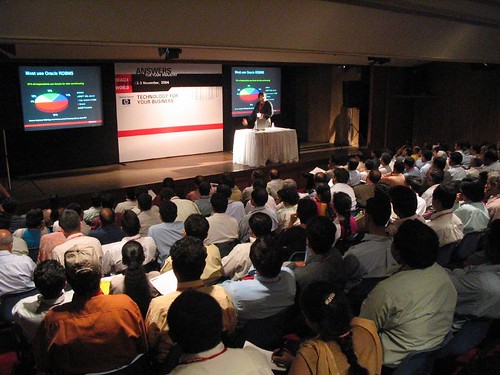
The BI demo pod, seen above, was kept very busy by customers who were interested in the new features in Discoverer 10.1.2 and wanted to upgrade from 9.0.4, 9.0.2, 4i, or even earlier versions. What they saw they liked. There were many others who were not aware of what Oracle offered by way of BI products and went back impressed. One person took a brief look at the drag and drop interface of Discoverer Plus with its query wizards, crosstab support, graphs, and said, 'this is so much better than what Microsoft offers' and went on to have a lengthy conversation with a sales consultant on the spot.
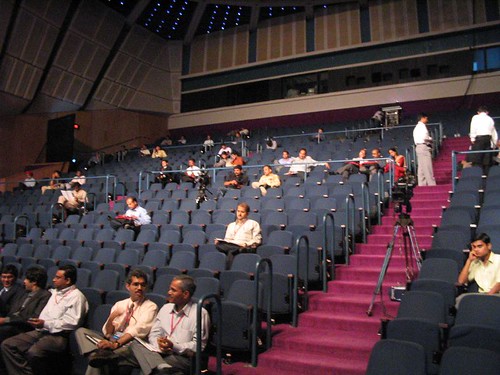
This is the main auditorium at the NCPA, where the keynotes and some presentations were held. The auditorium can seat close to a thousand people.
Sudip's BI presentation was very well attended. As you can see from the photo above, the room could seat about 150 people, all seats were taken, about a couple of dozen people were standing at the back, and an equal number could be seen waiting outside to get in.
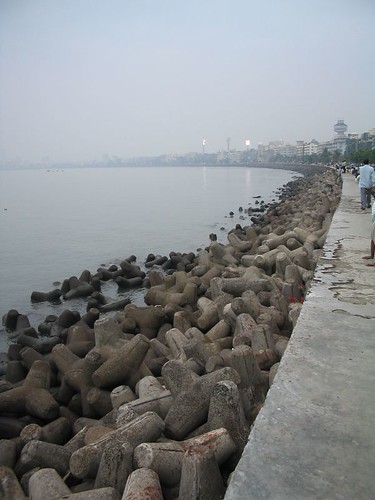
This is a photo of Bombay's Marine Drive, also known as the 'Queen's Necklace'. On the left side you have the Arabian Sea, while on the right side you have some of the most expensive real estate in India (well in excess of 20,000 rupees per square foot... that would be more than US$400/sq ft). The floodlights you see in the background are of the Wankhede cricket stadium. I believe the fourth test between Australia and India was on at that time. India won the match, but lost the series 2-1 :-(.
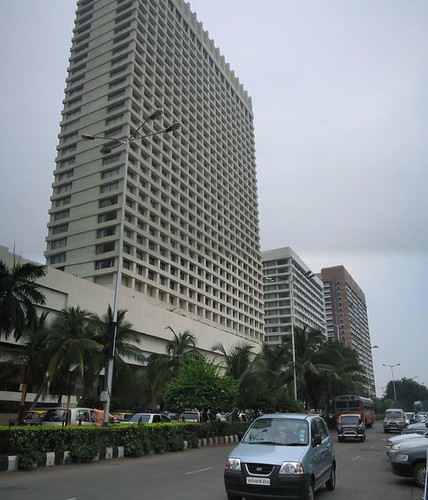
The tall building in the foreground is the Hilton Towers. Till a few years back it used to be called Oberoi Towers. More than 30 years old, the hotel is a landmark, and with the Air India building lends a very distinctive look to Nariman Point.

Tuesday, January 03, 2006

OOW Mumbai - 2

To follow up on my last post on Open World Mumbai (link to post) there are going to be keynotes by senior Oracle executives like Charles Philips (President, Oracle Corporation), Derek Williams (Executive Vice President Asia Pacific Division), Krishan Dhawan (Managaing Director, Oracle India), and Mark Gibbs (Senior Vice President Applications Sales, Asia Pacific Division) leading industry figures like Mr. K.V.Kamath (Managing Director and Chief Executive Oficer, ICICI Bank), S. Ramadorai (Chief Executive Officer & Managing Director, Tata Consultancy Services), and Pramod Bhasin (President & Chief Executive Officer, Genpact – formerly GE Capital Information Service) are also slated to speak.
ICICI Bank (link to corporate site) is India's second largest and largest private sector bank with assets of about US$40 billion, while TCS is India's largest IT software and services company (with annual revenues of INR 91 billion - that would be approximately US$2.1 billion at the then prevailing exchange rates).

Apart from BI presentations, there will be two demo pods on Business Intelligence in the demo grounds. These will feature the latest production software and consultants from OracleDirect and product management and development will be on hand to answer queries. Specifically, product management and development will answer questions people may have on what's in the works and what to expect with future releases. For example, Oracle announced Oracle Application Server 10g Release 3 (that would 10.1.3 for short) last year (see link to article on TheServerSide.COM) and you can expect to get some answers on what's new and maybe even see some previews of the software there at the demo grounds (see link to the 10.1.3 release on OTN).

There are three BI related sessions; the first one will be presented by Rajesh Gadodia. I had presented on the same topic at the 2004 Open World in Mumbai, and had Kirloskar Cummins as a co-presenter. At that time Discoverer and Oracle BI 10.1.2 was in pre-production stage, and we were still a couple of months from releasing the product to the market. 10.1.2 has now been in the market for over a year and doing quite well (look at the earnings of one of the . One of the things that I will talk about in the demo grounds will be a few of the things we are working on. I am working on talking about a couple of exciting new things that are in the works. You may already have heard them through your Oracle account manager or sales rep.

I don't know yet who the other two presenters are. All three tracks fall under the Enterprise Technology track.
  • Interactive Business Intelligence Dashboards for Fact Based Decision Making
  • Large-scale data warehousing, end-user query, reporting and predictive analytics with Oracle Database 10g and Oracle Business Intelligence 10g
  • Oracle Partner Applications 1) Improve productivity with Workflow and Document Management System 2)Analyse Information in Real Time for Decision Makers using Business Intelligence

Monday, January 02, 2006

OOW in Mumbai

There is a mini Open World in Mumbai (Bombay) next week (Jan 10, 11 2006) (link to Oracle.com page) that I shall be attending. This is similar to the last Open World held at Mumbai last year oops... in 2004 (it is 2006 now!), albeit on a slightly smaller scale I think. The 2004 Mumbai Open World was very successful it seems, and hence the encore.

More to follow sooon.

Friday, November 11, 2005

List of all posts

Posts at a glance (in reverse chronological order)
A list of all the posts on this blog. I will update this list periodically. And also place a link to this post from the nav bar, for convenience.
Last updated: Oct 17 2006, 5:15 PM IST
  1. IDC Ranks Oracle No 1 in Business Analytics
  2. View this blog in multiple languages
  3. Spreadsheet Add-in - Refreshing multiple queries
  4. Why Is the blog getting so many hits
  5. Some blog stats
  6. Spreadsheet Add-In - non modal wizard
  7. Oracle Discoverer at OpenWorld
  8. Mere Paas BI Hai
  9. Welcoming Mike Durran as the new BI blogger
  10. X-Treme at Oracle OpenWorld
  11. Rename queries in Spreadsheet Add-In 10.1.2.2
  12. Discoverer 4i desupport for EBS 11i
  13. Office - Excel, Word, PowerPoint, Outlook, and more
  14. Know any product managers?
  15. Gartner on Oracle and Sigma Dynamics deal
  16. From Michael's blog
  17. More on OpenWorld and BI
  18. Oracle Open World and BI
  19. BI/DW Training at OpenWorld 2006
  20. OracleBI Spreadsheet Add-in advantages
  21. And a new BI blogger
  22. Row Banding in Oracle Answers
  23. Free OWB and DM Review seminar
  24. Winter Corp's Spotlight on Oracle White Paper
  25. Upcoming BI releases
  26. ODTUG Conference Day 2
  27. Live from ODTUG...Monday
  28. Two blog posts on ODTUG 2006
  29. Small but neat feature in 'Answers'
  30. New Graph styles in the upcoming Discoverer release
  31. OWB OBEs now available
  32. The Discoverer Handbook 10g on Amazon
  33. Oracle leads in DBMS marketshare - IDC and Gartner studies
  34. Firefix the memory hog
  35. Oracle Warehouse Builder 10gR2 (Paris) available for download
  36. Great Data Mining blog post on DM SQL
  37. Incremental fetch for graphs - totals only graphs
  38. Incremental Fetch in Graphs
  39. Discoverer presentations at ODTUG 2006 Kaleidoscope
  40. ODTUG Kaleidoscope 2006
  41. Market Share Analysis not rocket science
  42. Research Notes on Oracle BI
  43. In the US next week
  44. Day and a half versus an hour and ten minutes
  45. Great Analysis Article on Oracle BI From Bloor Research
  46. Graph displayed data in Viewer
  47. Oracle Data Miner 10.2.0.1 Tutorial Available
  48. Another Oracle Blog - on Apps Technology
  49. Download a sample chapter from the Discoverer 10g Handbook
  50. Poll results
  51. Final call to vote for your must-have Discoverer features
  52. ProClarity No More
  53. Take the poll for must-have Discoverer features
  54. Congratulations to Michael for his ACE Nomination
  55. Must Have In Discoverer
  56. Michael's Discoverer Blog is up and running now
  57. Oracle and Office Interoperability Center on OTN
  58. Oracle BI Suite Standard Edition
  59. Oracle's BI Strategy Briefing
  60. The Discoverer 10g Handbook from Michael Armstrong-Smith
  61. How To Customize The Export Formats List in Viewer
  62. Add A Quick Export Link to the Worksheet Page
  63. The Discoverer Blog from Michael Armstrong-Smith
  64. Oracle Development Survey on Data Warehouses: How Does Yours Compare? Here's how to find out!
  65. More Oracle Executive Blogs
  66. Day 2 of RMOUG Conference
  67. Rocky Mountain User Group Meeting,
  68. The Oracle Data Mining Blog
  69. Flash based introduction of Oracle Data Warehousing now available
  70. Blogs dot Oracle dot com - Finally here
  71. More on Oracle BI and Siebel Analytics
  72. Using Excel as a data source for building dimensions and cubes
  73. Blogs on Oracle.com coming soon?
  74. App Server 10.1.3 is now available
  75. How Do You Debug OLAP DML from BI Beans Part 2
  76. Press clippings in the media for Open World Mumbai
  77. All Open World Mumbai 2006 Links
  78. Siebel Analytics and the Oracle acquisition
  79. Other Open World Mumbai 2006 Vignettes
  80. Open World Mumbai 2006 - City photos 1
  81. Open World Mumbai - 4
  82. Webcast URL for Open World Mumbai 2006
  83. A couple of new docs available on OTN
  84. Open World Mumbi 2004 - Vignettes
  85. OOW Mumbai - 2
  86. OOW in Mumbai
  87. How Do You Debug OLAP DML from BI Beans?
  88. Standalone Discoverer 10g (10.1.2.0.2) clients now fully SSO compliant for E-Business Suite users
  89. UIX Hack 4 - Removing the worksheet breadcrumb
  90. From detail to summary in two clicks
  91. PDF Settings in Viewer
  92. Multiple Conditional Formats on the same item
  93. Discoverer Is Not Supported On XE
  94. Using BI Beans with non-OLAP data source
  95. Expiration of scheduled workbooks
  96. Oracle XE Database and Discoverer - 3 - Opening and Creating Workbooks
  97. List of all posts
  98. Oracle XE Database and Discoverer - 2 - Creating the EUL
  99. Beyond the BI Graph Wizard
  100. Going Beyond the BI Graph Wizard
  101. Oracle XE Database and Discoverer - 1 - Installing XE
  102. Intelligently building OLAP cubes with data mining
  103. Top Ten Design Mistakes for Weblogs
  104. Article: Oracle to pitch open-source database against Microsoft and Sybase
  105. More with the Spreadsheet Add-In - 10.1.2.1
  106. Using the Spreadsheet Add-In - 10.1.2.1
  107. Oracle's executive blogs
  108. Installing the Spreadsheet Add-In - 10.1.2.1
  109. New versions of AWM and Spreadsheet Add-In available
  110. Oracle Data Miner 10gR2 beta now available, with a Discoverer bridge
  111. Out of town, with a busy two weeks coming up...
  112. Queries you can easily understand.....
  113. Open World 2005 Attendance Graphs - with Discoverer
  114. More on the bubble graph
  115. Making more of BI Graphs....
  116. Creative Use of the IQY Export Format
  117. Loose lips sink ships
  118. Performance improvements and SQL optimizations
  119. Larry Ellison on BI
  120. On Vendor Weirdness
  121. UIX Hack 3 - Removing the 'type' column from a portlet
  122. How read is a blog before you can call it a well-read blog
  123. Activity Guide to OOW BI&DW Sessions
  124. Displaying only selected page items or parameters in the title
  125. And Then There Was One Less (Oracle buying Siebel)
  126. Record OpenWorld registrations
  127. UIX Hack 2 – Remove the Last Refresh Date from Discoverer Portlets
  128. Phase 2 Nugget - The navigator preferences
  129. Know More About Oracle BI
  130. BI at Oracle OpenWorld this year
  131. Oracle's BI strategy presentation
  132. Some Discoverer OLAP - D4O - queries answered
  133. UIX Hack 1 - Removing the 'Connect Directly' section
  134. BI Tools, Forms & Reports Services, and more now available for Phase 2
  135. Phase 2 available on Windows also
  136. Change PDF options when emailing reports
  137. Phase 2 Nugget - Change paper size in Plus
  138. 10.1.2.0.2 - Phase 2 is now available on OTN
  139. Phase 2 Doc is now available
  140. Passing a password to Viewer
  141. OLAP 10g R2 web seminar
  142. A first look at installing Discoverer using the Oracle Application Server - 10.1.2.0.2 (Phase 2)
  143. More on OTN Forums
  144. BI Forums on OTN
  145. Why You Should NOT Publish Large Worksheets to Portal
  146. Updating Multiple Discoverer Portlets Using Portal Page Parameters
  147. Welcome

    Thursday, October 06, 2005

    Open World 2005 Attendance Graphs - with Discoverer

    What's the good thing about eating your own dog food? Before you think I have meandered into a discourse on canine culinary dietetics, let me assure that I only use this phrase to refer to the practice of a company using its own products internally. Therefore, in the context of BI, you should have guessed by now that I am referring to using Oracle BI 10g to report on all sorts of data.

    The session/track attendance numbers from the San Francisco Oracle Open World came out late last week, and a couple of PMs from the BI group took those numbers, built a Discoverer EUL on top of it, and cranked out a number of reports, and all in less time than it would take to say 'Wow! That was quick, and good!' (btw - the final numbers were that more than 35,000 people attended Open World! And if the Siebel acquisition goes through, then expect that number to go up even more!)

    This post is not really about the data per-se, but more of a followup on the last couple of posts from Keith and me on the value of graphs and the huge number of very useful graphs already available in BI 10g - Discoverer, Beans, etc... (specifically, see 'Making more of BI Graphs' and 'More on the bubble graph').

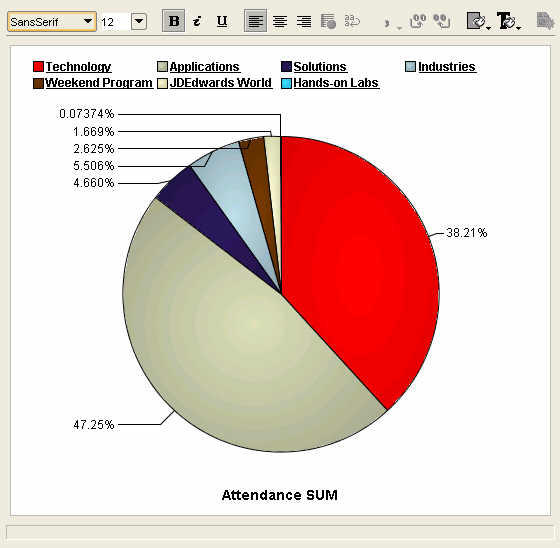
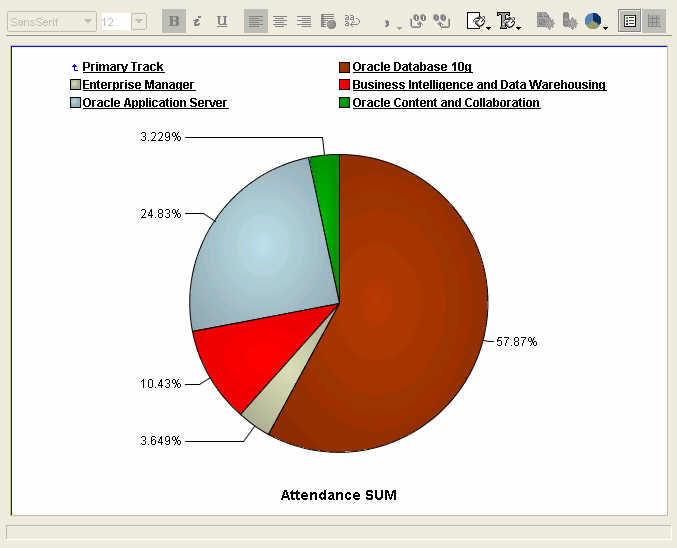
    Bubble graph - here the X-axis represents the number of sessions , Y-axis the average attendance per session, while the size of the bubble is the percentage of sessions in a track that were more than the conference average.A standard pie graph, each slice represents a primary track, and the percentage figures are for total track attendance.
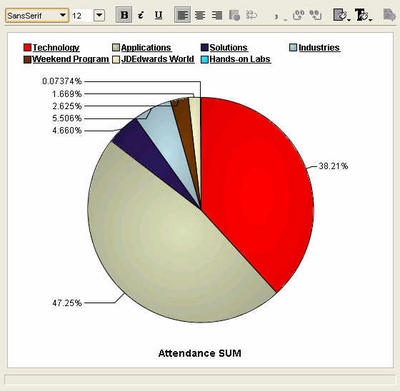
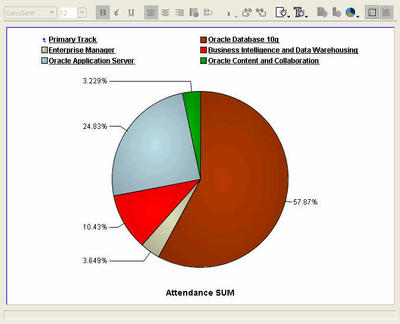
    Click on the 'Technology' track legend label, or double-click the pie slice, and the pie graph updates with percentages for the Tech-tracks. The database continues to garner the lion's share of the attendees, with the application server following at 25%, and BI-DW in third place in a little over 10% share of all Tech-track attendees.
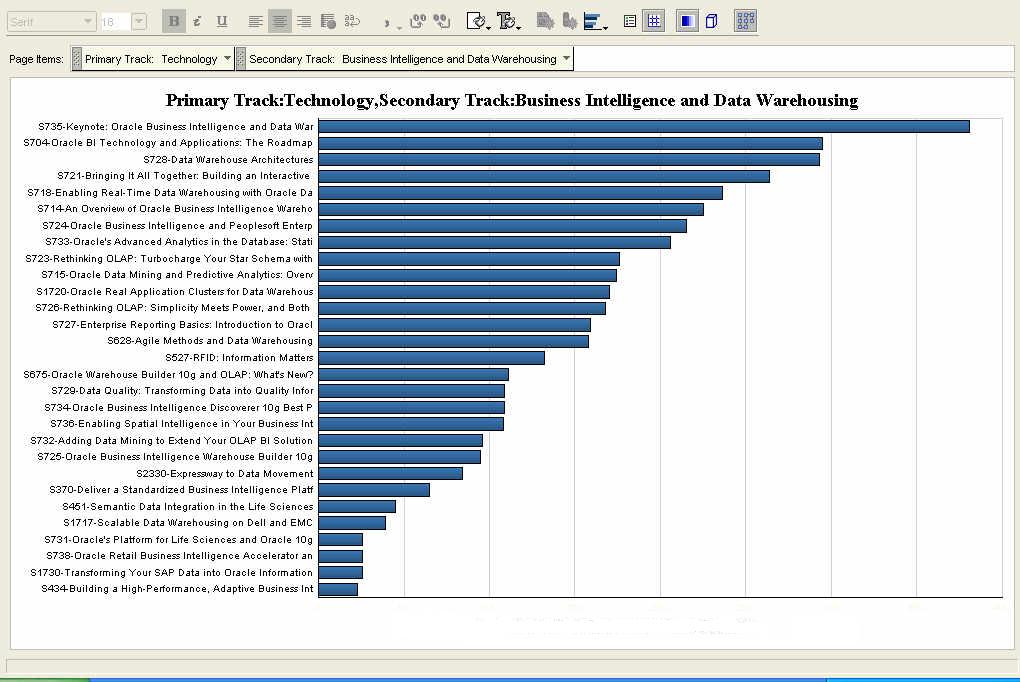
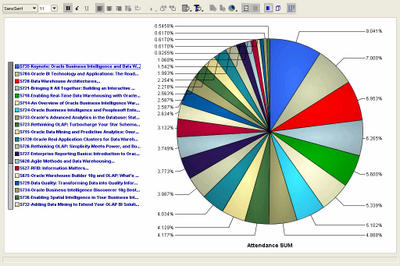
    And this is an example of running amok with a pie chart. And also illustrates very nicely how a different graph may make this data look much more readable. The pie chart below shows attendance percentage figures for all the BI-DW track sessions, all 29 of them. Not very useful, right? Let us take a look at the next graph then.
    This is a graph showing the same data, but this time as a horizontal bar graph. That's it. A simple click of the mouse, and I changed the graph type from 'pie' to 'horizontal bar'! When we say Discoverer is simple to use, we are serious.
    Ray's BI keynote was, unsurprisingly, the most heavily attended session. This was also the only keynote for the BI-DW track. And this session was also the one where the now-fabled Report Center was shown, publicly, for the first time. (Disclaimer: I am not saying that Report Center will be called Report Center when it ships, if it ships. Take it only as a demonstration vehicle of concepts and designs we have been working on internally, nothing more, nothing less.)

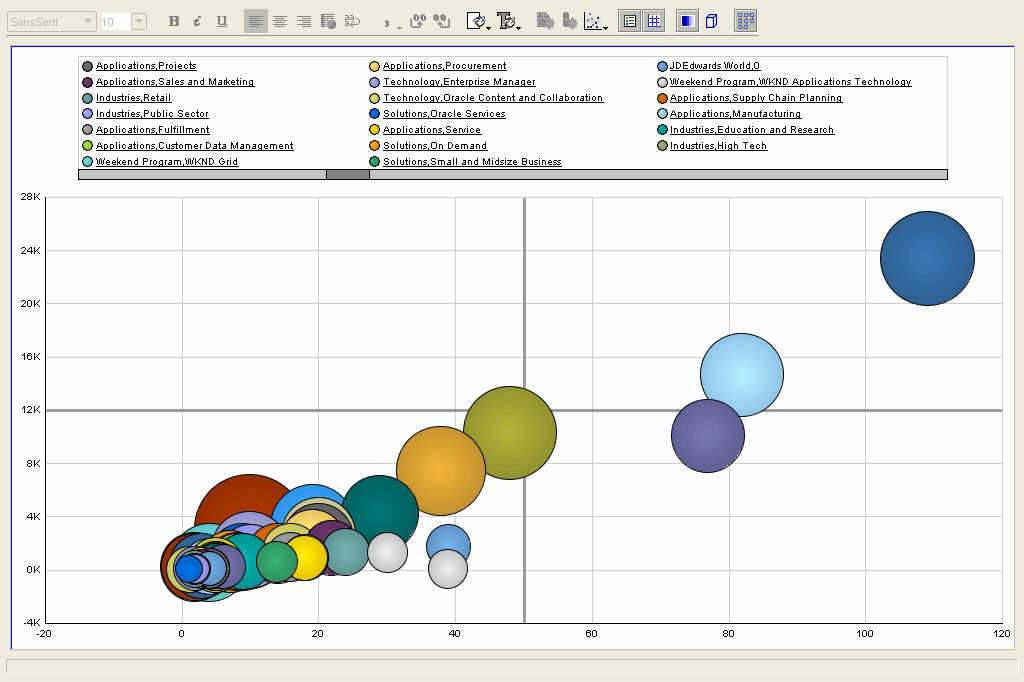
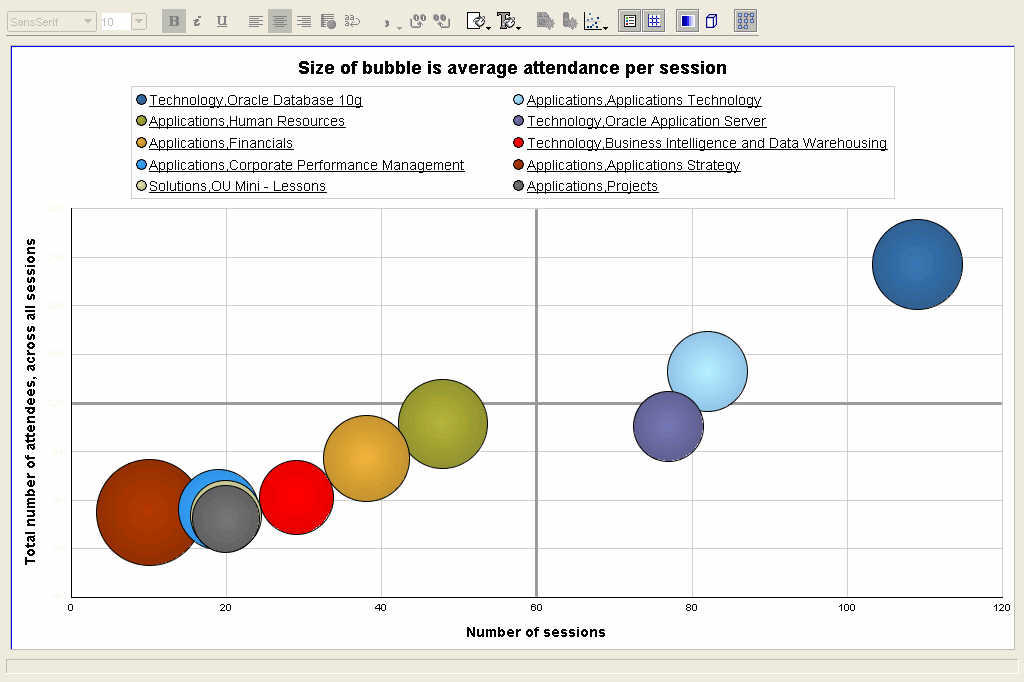
    Below are two bubble graphs, showing the same data, but the second displays a smaller set than the first one. The X-axis shows the number of sessions, while the Y-axis shows the total number of attendees for the track. The size of the bubble is the average attendance per session. But with so many sessions, this magic quadrant is not very readable, is it?
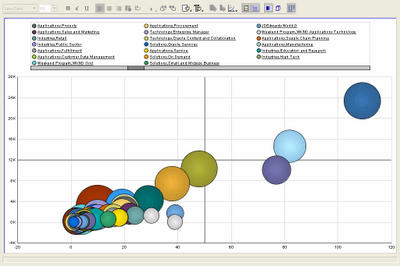
    Here I have taken the same graph as above, but applied a ranking filter to display only the top 10 sessions - where the ranked measure is total number of attendees. BI-DW is the bright red bubble, below and to the left of the orang-ish bubble. This is only one way of showing the bubble graph - you could decide that the size of the bubble should be the number of sessions, and that average attendance should be plotted as an ordinate or abscissa. Either way it's your choice.
    Pareto graphs are very useful for performing 80-20 type of analysis. The bars show the values that make the whole, while the line shows the cumlative percentage contribution of the individual parts thus. It is sometimes also called a 80-20 graph because these graphs illustrate very vividly the fact that usually 80% of something is contributed by 20% of its constitutents. E.g. 80% of a company's profits may be coming from only 20% of the products it sells. Here in this example it should come as no surprise that applications and technology accounted for more than 80% of all attendance.
    Update: I posted this, and then realized that I hadn't answered the semi-rhetorical question I had posed at the start of this post, "What's the good thing about eating your own dog food?". Well, I am hoping that people won't really expect an answer to it, after having read the post, but for the sake of completeness: when you eat your own dog food, you use the product like a customer. Which means that you are not using it as a developer, or QA engineer, or product manager, or support engineer, or sales person. You are using it like a customer would, doing the things a customer would, and the things that you would try and rationalize about as a developer, you will positively get irritated with, as a customer. And this then engenders the most valuable and useful feeling that we as product managers and developers and testers should and must have: empathy!

    Wednesday, September 14, 2005

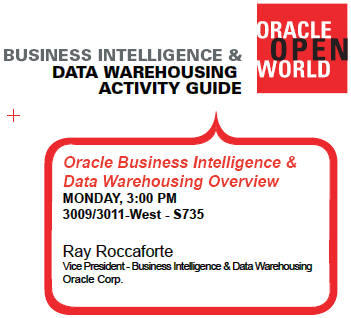
    Activity Guide to OOW BI&DW Sessions

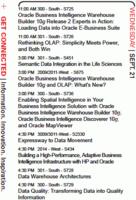
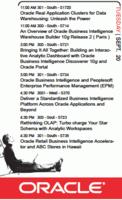
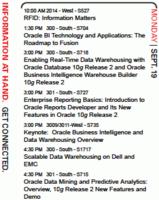
    If you are attending OpenWorld, and are interested in the BI&DW sessions, there is a small handout available on OTN which lists out all the BI&DW sessions. You can download the PDF from the OTN BI site here.
    This is what the front of the guide looks like (the PDF is obviously larger)
    Click to download the PDF file from OTNClick to download the PDF file from OTNClick to download the PDF file from OTN

    And this is the back.
    Click to download the PDF file from OTNClick to download the PDF file from OTN