If you see the Discoverer 11g Documentation library at http://download.oracle.com/docs/cd/E12839_01/pfrd.htm, you will notice the familiar set of docs, with one new addition. There is now a doc for the Discoverer Web Services. The "Oracle® Fusion Middleware User's Guide for Oracle Business Intelligence Discoverer Web Services API", 11g Release 1 (11.1.1), Part Number E10412-01 can be viewed at http://download.oracle.com/docs/cd/E12839_01/bi.1111/e10412/toc.htm, or downloaded as a PDF from http://download.oracle.com/docs/cd/E12839_01/bi.1111/e10412.pdf
As a brief intro, these web services are a layer of SOAP based web services that sit on top of Discoverer, provide access to a variety of functions, and provide a level of abstraction from the underlying implementation of the functionality that these services expose.
The very first instance where these web services were used was in the integration between BI Publisher and Discoverer (see my posts on this topic from 2007), that happened with the BI Publisher 10.1.3.3.0 release and Discoverer 10.1.2.2 release in 2007. Actually, there was a one-off patch that had to be applied on top of Discoverer 10.1.2.2 which contained the web services libraries. However, these web services were not yet meant to be consumed externally by customers for building their custom integrations. The intent was to document these and release them with the Discoverer 11g release. There is a slightly fascinating history behind the evolution of this project that I will try and blog about in a future post.
The other place where these web services shall be used is in the integration of Discoverer with the Oracle Business Intelligence Suite Enterprise Edition Plus, also referred to sometimes as simply OBIEE. Specifically, and since this is about functionality not yet released, please bear in mind that some or all of this could change, so do not take this as official Oracle communication, the intent is to use these Discoverer web services to publish Discoverer worksheets to an OBIEE Dashboard page, and to also use these same web services to allow OBIEE Delivers to run and send Discoverer worksheets on a scheduled basis.
More later.
Showing posts with label BI EE Answers. Show all posts
Thursday, July 02, 2009
Wednesday, February 21, 2007
SQL Access to OLAP Cubes
SQL Access to Cubes
Many people have asked: is possible to use normal SQL to access a multi-dimensional cube and associated dimensions? The answer is yes. What this means is that customers using BI EE, BI Publisher, SQL Developer and any other SQL reporting tool can access a 10g R2 OLAP multi-dimensional cube. However, a small warning -
If you plan to use SQL access with an end-user query tool, that tool needs to be able to support embedded total objects.
The SQL access to an OLAP cube returns all the required data points already precomputed so there is no need to issue an aggregation function (for example SUM()) with a GROUP BY command as the aggregation is managed internally within the cube itself. Using SQL Developer most DBAs can probably work around this feature by manually writing the query themselves. But for business users the tool is supposed to do all the work for them so it needs to be “embedded total” aware. Fortunately, BI EE can support this type of data source, so BI EE customers can combine Oracle 10g OLAP data with data from their other non-olap data sources quickly and easily.
(Unfortunately, Discoverer does not at the moment support embedded total objects so integrating SQL access to OLAP into the EUL is currently not possible).
How do you SQL enable an OLAP cube?
For this example I will use the common schema sample shipped with BI 10g (SH_OLAP schema) which contains a dimension called PRODUCTS that has the following structure:
To query the PRODUCTS dimension using SQL you have to create a view, which would look something like this:
PRODUCTS VARCHAR2(4000) WEIGHT_CLASS VARCHAR2(4000) PACK_SIZE VARCHAR2(4000) PRODUCTS_SDSC VARCHAR2(4000) PRODUCTS_LDSC VARCHAR2(4000) PRODUCTS_PRODUCT_LVLDSC VARCHAR2(4000) PRODUCTS_SUBCATEGOR_LVLDSC VARCHAR2(4000) PRODUCTS_CATEGORY_LVLDSC VARCHAR2(4000) PRODUCTS_PROD_TOP_LVLDSC VARCHAR2(4000) PRODUCTS_STANDARD_PRNT VARCHAR2(4000) PRODUCTS_LEVEL VARCHAR2(4000) PRODUCT_ID VARCHAR2(4000) SUPPLIER_ID VARCHAR2(4000) UNIT_OF_MEASURE VARCHAR2(4000)
The SQL query used to provide the data needs to be defined as follows:
CREATE OR REPLACE FORCE VIEW "SH_OLAP"."PRODUCTS_DIMVIEW" (
"PRODUCTS"
, "PRODUCTS_LEVEL"
, "PRODUCT_ID"
, "SUPPLIER_ID"
, "UNIT_OF_MEASURE"
, "WEIGHT_CLASS"
, "PACK_SIZE"
, "PRODUCTS_SDSC"
, "PRODUCTS_LDSC"
, "PRODUCTS_PRODUCT_LVLDSC"
, "PRODUCTS_SUBCATEGOR_LVLDSC"
, "PRODUCTS_CATEGORY_LVLDSC"
, "PRODUCTS_PROD_TOP_LVLDSC"
, "PRODUCTS_STANDARD_PRNT")
AS SELECT "PRODUCTS"
,"PRODUCTS_LEVEL"
,"PRODUCT_ID"
,"SUPPLIER_ID"
,"UNIT_OF_MEASURE"
,"WEIGHT_CLASS"
,"PACK_SIZE"
,"PRODUCTS_SDSC"
,"PRODUCTS_LDSC"
,"PRODUCTS_PRODUCT_LVLDSC"
,"PRODUCTS_SUBCATEGOR_LVLDSC"
,"PRODUCTS_CATEGORY_LVLDSC"
,"PRODUCTS_PROD_TOP_LVLDSC"
,"PRODUCTS_STANDARD_PRNT"
FROM table(OLAP_TABLE ('SH_OLAP.SH_AW duration session', '', '', '&(PRODUCTS_LIMITMAP)'))
MODEL DIMENSION BY ( PRODUCTS) MEASURES
( PRODUCTS_LEVEL
, PRODUCT_ID
, SUPPLIER_ID
, UNIT_OF_MEASURE
, WEIGHT_CLASS, PACK_SIZE
, PRODUCTS_SDSC
, PRODUCTS_LDSC
, PRODUCTS_PRODUCT_LVLDSC
, PRODUCTS_SUBCATEGOR_LVLDSC
, PRODUCTS_CATEGORY_LVLDSC
, PRODUCTS_PROD_TOP_LVLDSC
, PRODUCTS_STANDARD_PRNT )
RULES UPDATE SEQUENTIAL ORDER();
Now the view looks reasonably straightforward until you get about half through the code and notice the use of an OLAP_TABLE() function. This function returns a normal two-dimensional relational table structure from the source multi-dimensional object. The function has a number of inputs one of which is a call to a LIMIT_MAP. The OLAP_TABLE uses a limit map to map dimensions and measures defined in an analytic workspace to columns in a logical table. The limit map combines with the WHERE clause of a SQL SELECT statement to generate a series of OLAP DML LIMIT commands that are executed in the analytic workspace.
Oracle OLAP Reference Manual 10g Release 2 provides more details on the OLAP_TABLE() function.
In this example the limit map is called PRODUCTS_LIMITMAP and is stored within the analytic workspace and it looks like this:
DIMENSION PRODUCTS FROM PRODUCTS WITH
HIERARCHY PRODUCTS_STANDARD_PRNT FROM
PRODUCTS_PARENTREL(PRODUCTS_HIERLIST 'STANDARD')
INHIERARCHY PRODUCTS_INHIER FAMILYREL
PRODUCTS_PROD_TOP_LVLDSC
, PRODUCTS_CATEGORY_LVLDSC
, PRODUCTS_SUBCATEGOR_LVLDSC
, PRODUCTS_PRODUCT_LVLDSC
FROM PRODUCTS_FAMILYREL(PRODUCTS_LEVELLIST 'PROD_TOP')
, PRODUCTS_FAMILYREL(PRODUCTS_LEVELLIST 'CATEGORY')
, PRODUCTS_FAMILYREL(PRODUCTS_LEVELLIST 'SUBCATEGORY')
, PRODUCTS_FAMILYREL(PRODUCTS_LEVELLIST 'PRODUCT')
LABEL PRODUCTS_LONG_DESCRIPTION
ATTRIBUTE UNIT_OF_MEASURE FROM PRODUCTS_UNIT_OF_MEASURE
ATTRIBUTE SUPPLIER_ID FROM PRODUCTS_SUPPLIER_ID
ATTRIBUTE PRODUCT_ID FROM PRODUCTS_PRODUCT_ID
ATTRIBUTE PRODUCTS_LEVEL FROM PRODUCTS_LEVELREL
ATTRIBUTE PRODUCTS_LDSC FROM PRODUCTS_LONG_DESCRIPTION
ATTRIBUTE PRODUCTS_SDSC FROM PRODUCTS_SHORT_DESCRIPTION
ATTRIBUTE PACK_SIZE FROM PRODUCTS_PACK_SIZE
ATTRIBUTE WEIGHT_CLASS FROM PRODUCTS_WEIGHT_CLASS
It maps the AW objects to the columns referenced within the view. Having the limit map defined within the AW as a text variable makes it easier to modify the data that can be returned into the view by the analytic workspace.
The same techniques can be used to create a view to return data form a cube. Making a view over the sales cube, which contains 35 measures and attributes relating to 4 dimensions (Time, Channel, Geography, Products), would look something like this:
TIME VARCHAR2(4000)
CHANNELS VARCHAR2(4000)
GEOGRAPHIES VARCHAR2(4000)
PRODUCTS VARCHAR2(4000)
TIME_LEVEL VARCHAR2(4000)
TIME_LDSC VARCHAR2(4000)
TIME_CAL_MONTH_LVLDSC VARCHAR2(4000)
TIME_CAL_QTR_LVLDSC VARCHAR2(4000)
TIME_CAL_YEAR_LVLDSC VARCHAR2(4000)
TIME_CALENDAR_PRNT VARCHAR2(4000)
CHANNELS_LEVEL VARCHAR2(4000)
CHANNELS_LDSC VARCHAR2(4000)
CHANNELS_CHANNEL_LVLDSC VARCHAR2(4000)
CHANNELS_CLASS_LVLDSC VARCHAR2(4000)
CHANNELS_TOP_LVLDSC VARCHAR2(4000)
CHANNELS_STANDARD_PRNT VARCHAR2(4000)
GEOGRAPHIE_LEVEL VARCHAR2(4000)
GEOGRAPHIE_LDSC VARCHAR2(4000)
GEOGRAPHIE_COUNTRY_LVLDSC VARCHAR2(4000)
GEOGRAPHIE_SUBREGION_LVLDSC VARCHAR2(4000)
GEOGRAPHIE_REGION_LVLDSC VARCHAR2(4000)
GEOGRAPHIE_WORLD_LVLDSC VARCHAR2(4000)
GEOGRAPHIE_STANDARD_PRNT VARCHAR2(4000)
PRODUCTS_LDSC VARCHAR2(4000)
PRODUCTS_PROD_TOP_LVLDSC VARCHAR2(4000)
PRODUCTS_STANDARD_PRNT VARCHAR2(4000)
PRODUCTS_LEVEL VARCHAR2(4000)
PRODUCT_ID VARCHAR2(4000)
PRODUCTS_PRODUCT_LVLDSC VARCHAR2(4000)
PRODUCTS_SUBCATEGOR_LVLDSC VARCHAR2(4000)
PRODUCTS_CATEGORY_LVLDSC VARCHAR2(4000)
REVENUE BINARY_DOUBLE
SR_MA_12M BINARY_DOUBLE
SR_MA_6M BINARY_DOUBLE
SR_PC_PP BINARY_DOUBLE
SR_PC_YA BINARY_DOUBLE
GEOGRAPHY_SHARE_PARENT NUMBER
GEOGRAPHY_SHARE_TOTAL BINARY_DOUBLE
PRODUCT_SHARE_PARENT NUMBER
PRODUCT_SHARE_TOTAL BINARY_DOUBLE
CHANNEL_SHARE_TOTAL BINARY_DOUBLE
CHANNEL_SHARE_PARENT NUMBER
With a view over the cube it is now possible to select values from the cube from any level without having to issue an aggregation function or worry about using a GROUP BY command. For example, to create a report that shows the revenue, 12 month moving average, 6 month moving average, % growth from prior period, % growth from prior year for 1999, 2000 and 2001, for products at the Category level, for all channels and for all geographies the query could be written as follows:
COLUMN TIME_LDSC FORMAT A7
COLUMN PRODUCTS_LDSC FORMAT A35
COLUMN REVENUE FORMAT 999,999,999.99
COLUMN SR_MA_12M FORMAT 999,999,999.99
COLUMN SR_MA_6M FORMAT 999,999,999.99
COLUMN SR_PC_PP FORMAT 99.99 COLUMN
SR_PC_YA FORMAT 99.99
break on PRODUCTS_LDSC skip 1
select PRODUCTS_LDSC
, TIME_LDSC , REVENUE
, SR_MA_12M
, SR_MA_6M
, SR_PC_PP
, SR_PC_YA
from SALES_CUBEVIEW
where GEOGRAPHIE_LEVEL = 'WORLD'
AND TIME IN ('1803', '1804', '1805')
AND CHANNELS IN ('1')
AND PRODUCTS_LEVEL = 'CATEGORY'
ORDER BY PRODUCTS_LDSC , TIME_LDSC;
CLEAR COLUMN
The process for creating these special SQL views is now very simple thanks to a new plug-in for Analytic Workspace Manager. This has been created by OLAP product management team (Marty Gubar) and is an example of how to extend AWM using the new extensibility interface. Once you have downloaded and installed the addin you create your OLAP schema in the normal way. It is possible to create a relational view over both dimensions and cubes with the process being the same for both objects. Once you have loaded data into your analytic workspace right-mouse click on a dimension or cube and the “Create Relational View…” option should be visible at the bottom of the menu:

The first step of the wizard allows you to select the attributes and measures to make visible via the view. Be warned, you may have to deselect some attributes and/or measures to make this work. The reason being there is a SQL limit (4000 characters I think) within the process of defining a view, therefore, you may have to deselect some measures and/or attributes to successfully create the view. Unfortunately, no error message is displayed if things go wrong during the definition, however, when you try to select from the SQL view you may get an error message saying the LIMIT MAP does not exist. This implies you selected too many columns.

I am sure this issue will be resolved in a later build. For the moment it is not a major issue and the problem is quickly and easily resolved. Expand each node in the tree and deselect items that are not actually required:

Ideally when thinking about which views to create and the contents of those views you want to try and create views that minimize the need to use joins to create a result within the reporting tool such as BI EE. Therefore, it may be necessary to do some research first to determine which measures and attributes users actually need to allow them to create their reports. In other words do not try and expose every single attribute and measure.
This new addin to Analytic Workspace Manager (thanks to Marty Gubar) makes it very easy for BI EE customers to include data contained within a 10g OLAP cube as part of a BI EE report.
Useful Links
Analytic Workspace Manager
http://www.oracle.com/technology/software/htdocs/devlic.html?=http://download.oracle.com/otn/java/olap/AWM102030_Win.zip
Relational View Generator software
http://www.oracle.com/technology/products/bi/olap/viewGenerator_1_0.zip
Documentation: http://www.oracle.com/technology/products/bi/olap/ViewGenerator.html
Many people have asked: is possible to use normal SQL to access a multi-dimensional cube and associated dimensions? The answer is yes. What this means is that customers using BI EE, BI Publisher, SQL Developer and any other SQL reporting tool can access a 10g R2 OLAP multi-dimensional cube. However, a small warning -
If you plan to use SQL access with an end-user query tool, that tool needs to be able to support embedded total objects.
The SQL access to an OLAP cube returns all the required data points already precomputed so there is no need to issue an aggregation function (for example SUM()) with a GROUP BY command as the aggregation is managed internally within the cube itself. Using SQL Developer most DBAs can probably work around this feature by manually writing the query themselves. But for business users the tool is supposed to do all the work for them so it needs to be “embedded total” aware. Fortunately, BI EE can support this type of data source, so BI EE customers can combine Oracle 10g OLAP data with data from their other non-olap data sources quickly and easily.
(Unfortunately, Discoverer does not at the moment support embedded total objects so integrating SQL access to OLAP into the EUL is currently not possible).
How do you SQL enable an OLAP cube?
For this example I will use the common schema sample shipped with BI 10g (SH_OLAP schema) which contains a dimension called PRODUCTS that has the following structure:
- Levels:
- All Products
- Categories
- SubCategories
- Products
- Attributes
- Long Description
- Short Description
- Level Description
- Supplier ID
- Unit of Measure
- Weight Class
- Pack size
To query the PRODUCTS dimension using SQL you have to create a view, which would look something like this:
PRODUCTS VARCHAR2(4000) WEIGHT_CLASS VARCHAR2(4000) PACK_SIZE VARCHAR2(4000) PRODUCTS_SDSC VARCHAR2(4000) PRODUCTS_LDSC VARCHAR2(4000) PRODUCTS_PRODUCT_LVLDSC VARCHAR2(4000) PRODUCTS_SUBCATEGOR_LVLDSC VARCHAR2(4000) PRODUCTS_CATEGORY_LVLDSC VARCHAR2(4000) PRODUCTS_PROD_TOP_LVLDSC VARCHAR2(4000) PRODUCTS_STANDARD_PRNT VARCHAR2(4000) PRODUCTS_LEVEL VARCHAR2(4000) PRODUCT_ID VARCHAR2(4000) SUPPLIER_ID VARCHAR2(4000) UNIT_OF_MEASURE VARCHAR2(4000)
The SQL query used to provide the data needs to be defined as follows:
CREATE OR REPLACE FORCE VIEW "SH_OLAP"."PRODUCTS_DIMVIEW" (
"PRODUCTS"
, "PRODUCTS_LEVEL"
, "PRODUCT_ID"
, "SUPPLIER_ID"
, "UNIT_OF_MEASURE"
, "WEIGHT_CLASS"
, "PACK_SIZE"
, "PRODUCTS_SDSC"
, "PRODUCTS_LDSC"
, "PRODUCTS_PRODUCT_LVLDSC"
, "PRODUCTS_SUBCATEGOR_LVLDSC"
, "PRODUCTS_CATEGORY_LVLDSC"
, "PRODUCTS_PROD_TOP_LVLDSC"
, "PRODUCTS_STANDARD_PRNT")
AS SELECT "PRODUCTS"
,"PRODUCTS_LEVEL"
,"PRODUCT_ID"
,"SUPPLIER_ID"
,"UNIT_OF_MEASURE"
,"WEIGHT_CLASS"
,"PACK_SIZE"
,"PRODUCTS_SDSC"
,"PRODUCTS_LDSC"
,"PRODUCTS_PRODUCT_LVLDSC"
,"PRODUCTS_SUBCATEGOR_LVLDSC"
,"PRODUCTS_CATEGORY_LVLDSC"
,"PRODUCTS_PROD_TOP_LVLDSC"
,"PRODUCTS_STANDARD_PRNT"
FROM table(OLAP_TABLE ('SH_OLAP.SH_AW duration session', '', '', '&(PRODUCTS_LIMITMAP)'))
MODEL DIMENSION BY ( PRODUCTS) MEASURES
( PRODUCTS_LEVEL
, PRODUCT_ID
, SUPPLIER_ID
, UNIT_OF_MEASURE
, WEIGHT_CLASS, PACK_SIZE
, PRODUCTS_SDSC
, PRODUCTS_LDSC
, PRODUCTS_PRODUCT_LVLDSC
, PRODUCTS_SUBCATEGOR_LVLDSC
, PRODUCTS_CATEGORY_LVLDSC
, PRODUCTS_PROD_TOP_LVLDSC
, PRODUCTS_STANDARD_PRNT )
RULES UPDATE SEQUENTIAL ORDER();
Now the view looks reasonably straightforward until you get about half through the code and notice the use of an OLAP_TABLE() function. This function returns a normal two-dimensional relational table structure from the source multi-dimensional object. The function has a number of inputs one of which is a call to a LIMIT_MAP. The OLAP_TABLE uses a limit map to map dimensions and measures defined in an analytic workspace to columns in a logical table. The limit map combines with the WHERE clause of a SQL SELECT statement to generate a series of OLAP DML LIMIT commands that are executed in the analytic workspace.
Oracle OLAP Reference Manual 10g Release 2 provides more details on the OLAP_TABLE() function.
In this example the limit map is called PRODUCTS_LIMITMAP and is stored within the analytic workspace and it looks like this:
DIMENSION PRODUCTS FROM PRODUCTS WITH
HIERARCHY PRODUCTS_STANDARD_PRNT FROM
PRODUCTS_PARENTREL(PRODUCTS_HIERLIST 'STANDARD')
INHIERARCHY PRODUCTS_INHIER FAMILYREL
PRODUCTS_PROD_TOP_LVLDSC
, PRODUCTS_CATEGORY_LVLDSC
, PRODUCTS_SUBCATEGOR_LVLDSC
, PRODUCTS_PRODUCT_LVLDSC
FROM PRODUCTS_FAMILYREL(PRODUCTS_LEVELLIST 'PROD_TOP')
, PRODUCTS_FAMILYREL(PRODUCTS_LEVELLIST 'CATEGORY')
, PRODUCTS_FAMILYREL(PRODUCTS_LEVELLIST 'SUBCATEGORY')
, PRODUCTS_FAMILYREL(PRODUCTS_LEVELLIST 'PRODUCT')
LABEL PRODUCTS_LONG_DESCRIPTION
ATTRIBUTE UNIT_OF_MEASURE FROM PRODUCTS_UNIT_OF_MEASURE
ATTRIBUTE SUPPLIER_ID FROM PRODUCTS_SUPPLIER_ID
ATTRIBUTE PRODUCT_ID FROM PRODUCTS_PRODUCT_ID
ATTRIBUTE PRODUCTS_LEVEL FROM PRODUCTS_LEVELREL
ATTRIBUTE PRODUCTS_LDSC FROM PRODUCTS_LONG_DESCRIPTION
ATTRIBUTE PRODUCTS_SDSC FROM PRODUCTS_SHORT_DESCRIPTION
ATTRIBUTE PACK_SIZE FROM PRODUCTS_PACK_SIZE
ATTRIBUTE WEIGHT_CLASS FROM PRODUCTS_WEIGHT_CLASS
It maps the AW objects to the columns referenced within the view. Having the limit map defined within the AW as a text variable makes it easier to modify the data that can be returned into the view by the analytic workspace.
The same techniques can be used to create a view to return data form a cube. Making a view over the sales cube, which contains 35 measures and attributes relating to 4 dimensions (Time, Channel, Geography, Products), would look something like this:
TIME VARCHAR2(4000)
CHANNELS VARCHAR2(4000)
GEOGRAPHIES VARCHAR2(4000)
PRODUCTS VARCHAR2(4000)
TIME_LEVEL VARCHAR2(4000)
TIME_LDSC VARCHAR2(4000)
TIME_CAL_MONTH_LVLDSC VARCHAR2(4000)
TIME_CAL_QTR_LVLDSC VARCHAR2(4000)
TIME_CAL_YEAR_LVLDSC VARCHAR2(4000)
TIME_CALENDAR_PRNT VARCHAR2(4000)
CHANNELS_LEVEL VARCHAR2(4000)
CHANNELS_LDSC VARCHAR2(4000)
CHANNELS_CHANNEL_LVLDSC VARCHAR2(4000)
CHANNELS_CLASS_LVLDSC VARCHAR2(4000)
CHANNELS_TOP_LVLDSC VARCHAR2(4000)
CHANNELS_STANDARD_PRNT VARCHAR2(4000)
GEOGRAPHIE_LEVEL VARCHAR2(4000)
GEOGRAPHIE_LDSC VARCHAR2(4000)
GEOGRAPHIE_COUNTRY_LVLDSC VARCHAR2(4000)
GEOGRAPHIE_SUBREGION_LVLDSC VARCHAR2(4000)
GEOGRAPHIE_REGION_LVLDSC VARCHAR2(4000)
GEOGRAPHIE_WORLD_LVLDSC VARCHAR2(4000)
GEOGRAPHIE_STANDARD_PRNT VARCHAR2(4000)
PRODUCTS_LDSC VARCHAR2(4000)
PRODUCTS_PROD_TOP_LVLDSC VARCHAR2(4000)
PRODUCTS_STANDARD_PRNT VARCHAR2(4000)
PRODUCTS_LEVEL VARCHAR2(4000)
PRODUCT_ID VARCHAR2(4000)
PRODUCTS_PRODUCT_LVLDSC VARCHAR2(4000)
PRODUCTS_SUBCATEGOR_LVLDSC VARCHAR2(4000)
PRODUCTS_CATEGORY_LVLDSC VARCHAR2(4000)
REVENUE BINARY_DOUBLE
SR_MA_12M BINARY_DOUBLE
SR_MA_6M BINARY_DOUBLE
SR_PC_PP BINARY_DOUBLE
SR_PC_YA BINARY_DOUBLE
GEOGRAPHY_SHARE_PARENT NUMBER
GEOGRAPHY_SHARE_TOTAL BINARY_DOUBLE
PRODUCT_SHARE_PARENT NUMBER
PRODUCT_SHARE_TOTAL BINARY_DOUBLE
CHANNEL_SHARE_TOTAL BINARY_DOUBLE
CHANNEL_SHARE_PARENT NUMBER
With a view over the cube it is now possible to select values from the cube from any level without having to issue an aggregation function or worry about using a GROUP BY command. For example, to create a report that shows the revenue, 12 month moving average, 6 month moving average, % growth from prior period, % growth from prior year for 1999, 2000 and 2001, for products at the Category level, for all channels and for all geographies the query could be written as follows:
COLUMN TIME_LDSC FORMAT A7
COLUMN PRODUCTS_LDSC FORMAT A35
COLUMN REVENUE FORMAT 999,999,999.99
COLUMN SR_MA_12M FORMAT 999,999,999.99
COLUMN SR_MA_6M FORMAT 999,999,999.99
COLUMN SR_PC_PP FORMAT 99.99 COLUMN
SR_PC_YA FORMAT 99.99
break on PRODUCTS_LDSC skip 1
select PRODUCTS_LDSC
, TIME_LDSC , REVENUE
, SR_MA_12M
, SR_MA_6M
, SR_PC_PP
, SR_PC_YA
from SALES_CUBEVIEW
where GEOGRAPHIE_LEVEL = 'WORLD'
AND TIME IN ('1803', '1804', '1805')
AND CHANNELS IN ('1')
AND PRODUCTS_LEVEL = 'CATEGORY'
ORDER BY PRODUCTS_LDSC , TIME_LDSC;
CLEAR COLUMN
The process for creating these special SQL views is now very simple thanks to a new plug-in for Analytic Workspace Manager. This has been created by OLAP product management team (Marty Gubar) and is an example of how to extend AWM using the new extensibility interface. Once you have downloaded and installed the addin you create your OLAP schema in the normal way. It is possible to create a relational view over both dimensions and cubes with the process being the same for both objects. Once you have loaded data into your analytic workspace right-mouse click on a dimension or cube and the “Create Relational View…” option should be visible at the bottom of the menu:
The first step of the wizard allows you to select the attributes and measures to make visible via the view. Be warned, you may have to deselect some attributes and/or measures to make this work. The reason being there is a SQL limit (4000 characters I think) within the process of defining a view, therefore, you may have to deselect some measures and/or attributes to successfully create the view. Unfortunately, no error message is displayed if things go wrong during the definition, however, when you try to select from the SQL view you may get an error message saying the LIMIT MAP does not exist. This implies you selected too many columns.
I am sure this issue will be resolved in a later build. For the moment it is not a major issue and the problem is quickly and easily resolved. Expand each node in the tree and deselect items that are not actually required:
Ideally when thinking about which views to create and the contents of those views you want to try and create views that minimize the need to use joins to create a result within the reporting tool such as BI EE. Therefore, it may be necessary to do some research first to determine which measures and attributes users actually need to allow them to create their reports. In other words do not try and expose every single attribute and measure.
This new addin to Analytic Workspace Manager (thanks to Marty Gubar) makes it very easy for BI EE customers to include data contained within a 10g OLAP cube as part of a BI EE report.
Useful Links
Analytic Workspace Manager
http://www.oracle.com/technology/software/htdocs/devlic.html?=http://download.oracle.com/otn/java/olap/AWM102030_Win.zip
Relational View Generator software
http://www.oracle.com/technology/products/bi/olap/viewGenerator_1_0.zip
Documentation: http://www.oracle.com/technology/products/bi/olap/ViewGenerator.html
Tuesday, February 06, 2007
BI Publisher and BI EE Suite Integration - 1
This is the Oracle Interactive Dashboards page that is available by default (based on the default cataog and repositories available). If you click the "More Products" link, it drops down a list of additional products available to you - this list is dependent on the products you select during the installation. In the Siebel Business Analytics days, this list was actually governed by the license XML file you had. In Oracle you can download and install all the products you want - use them under a developer's license to evaluate them, and pay for them if you intend using them otherwise. If you chose to install BI Publisher, then this product will be listed as an option in the dropdown. Click the link.

You are taken to the Oracle BI Publisher Enterprise home page. Note that you do not have to re-login.

You can create new report by clicking the "Create a new report" and typing in the name of the report. The report is created under the current folder. You could always go and create a BI Publisher report against any supported data source, and that now includes RSS feeds also (have to check if that's been available before 10.1.3.2 also...). But in this case I shall create a report that goes against the BI Answers presentation layer.


If I click the "Edit" link for the report (see the list of links available - "View", "Schedule", "History", "Edit", "Configure"), it takes you to the page where you can edit the report, and change such things as the report's data source, data model, add/remove templates, etc...
Note below that there is a new "Data Source" available, named "Oracle BI EE".

That is the data source I shall use. Click the "Query Builder" button and it takes you to BI Publisher's "Online Query Builder". From the top right hand drop down I can select from either of the two subject areas available to me: "Paint" or "Paint Exec". The list of (logical) folders is based on the schema I select, in this case "Paint".
I can drag and drop any folder to the 'canvas', and check/uncheck the fields that I want included in my report. Note that I do not have to specify any joins here, as the BI Analytic Server shall take care of resolving any joins.

Click on the "Results" link, and the results of the query are fetched.

Click the "Save" button and you see the "SQL Query" field updated with the sql for the report. At this point, you can upload a template if you have one available, or use the "Oracle BI Publisher Template Builder for Word" to create a (or more than one) template and associate it with the report. That is a topic for another post, another day.
Also, there is the other side of this integration, which is the fact that you can publish BI Publisher reports to Interactive Dashboards. That also, I shall post soon.

To take a peek at how this integration has been done, click the "Admin" tab. On the Admin page, at the bottom you shall see a section named "Integration". "Oracle BI Presentation Services" is the link that you use to configure BI Publisher to integrate with Oracle BI Presentation Services.

The page shows you all the details - if you install Oracle BI EE using the complete install option, these values are filled in by the installer. Else you can always go back and add/change them.

Related posts:
You are taken to the Oracle BI Publisher Enterprise home page. Note that you do not have to re-login.
You can create new report by clicking the "Create a new report" and typing in the name of the report. The report is created under the current folder. You could always go and create a BI Publisher report against any supported data source, and that now includes RSS feeds also (have to check if that's been available before 10.1.3.2 also...). But in this case I shall create a report that goes against the BI Answers presentation layer.
If I click the "Edit" link for the report (see the list of links available - "View", "Schedule", "History", "Edit", "Configure"), it takes you to the page where you can edit the report, and change such things as the report's data source, data model, add/remove templates, etc...
Note below that there is a new "Data Source" available, named "Oracle BI EE".
That is the data source I shall use. Click the "Query Builder" button and it takes you to BI Publisher's "Online Query Builder". From the top right hand drop down I can select from either of the two subject areas available to me: "Paint" or "Paint Exec". The list of (logical) folders is based on the schema I select, in this case "Paint".
I can drag and drop any folder to the 'canvas', and check/uncheck the fields that I want included in my report. Note that I do not have to specify any joins here, as the BI Analytic Server shall take care of resolving any joins.
Click on the "Results" link, and the results of the query are fetched.
Click the "Save" button and you see the "SQL Query" field updated with the sql for the report. At this point, you can upload a template if you have one available, or use the "Oracle BI Publisher Template Builder for Word" to create a (or more than one) template and associate it with the report. That is a topic for another post, another day.
Also, there is the other side of this integration, which is the fact that you can publish BI Publisher reports to Interactive Dashboards. That also, I shall post soon.
To take a peek at how this integration has been done, click the "Admin" tab. On the Admin page, at the bottom you shall see a section named "Integration". "Oracle BI Presentation Services" is the link that you use to configure BI Publisher to integrate with Oracle BI Presentation Services.
The page shows you all the details - if you install Oracle BI EE using the complete install option, these values are filled in by the installer. Else you can always go back and add/change them.
Related posts:
- BI Enterprise Edition - First Look - Post Install
- Oracle BI Enterprise Edition - First Look - Instal...
- BI EE 7.8.5.2 also available
- BI EE 10gR3 - Go Get the software
- Online tutorial for BI EE
- BI EE Documentation now available
- Gartner Research Note on BI
- Oracle a leader in latest Gartner BI Platform Magi...
- Announcing Oracle Business Intelligence Enterprise...
Thursday, February 01, 2007
Online tutorial for BI EE
Ok, so someone is going to take me to task for calling it a 'tutorial' because the correct term to use is "OBE" - Oracle By Example. To quote from the Oracle documentation site, "Oracle by Example (OBE) tutorials provide hands-on, step-by-step instructions on how to implement various technology solutions to business problems. OBE solutions are built for practical real-world situations, allowing you to gain valuable hands-on experience as well as use the presented solutions as the foundation for production implementation, dramatically reducing time to deployment."
There are two OBEs for the BI EE 10.1.3 release that are immediately available, while more are in the works.
For those of you who look at the URL closely, especially the OBE on Answers, it shall tell you a little bit of the lingering traces of the product's lineage :-)
There are two OBEs for the BI EE 10.1.3 release that are immediately available, while more are in the works.
For those of you who look at the URL closely, especially the OBE on Answers, it shall tell you a little bit of the lingering traces of the product's lineage :-)
Thursday, September 14, 2006
X-Treme at Oracle OpenWorld
Keith and I have blogged about the upcoming Oracle OpenWorld conference (link to page on Oracle.com) in San Francisco next month (Oct 22-26 2006).This year, the X-Treme program (link) offers highly technical, deep-dive content through a series of intense breakout sessions and X-Treme hands-on workshops. It covers twelve tracks on various topics including business intelligence. The BI track (link) shall cover Oracle BI Suite Enterprise Edition (link to product page on OTN). There, "you will learn how to use the components of Oracle BI EE, including Oracle BI Answers, BI Dashboards, BI Advanced Reporting, BI Delivers, and BI Server Administration. Join us for deep-dive BI hands-on workshops that you won't find on the regular OpenWorld agenda."
This is an awesome way to learn more about the products and meet the people behind the products (except me, I shall not be attending OpenWorld this year
Click on the banner above or click this link to learn more about and register for X-Treme.
Here is a link to all the special programs on offer at this year's OpenWorld.
Tuesday, August 01, 2006
BI/DW Training at OpenWorld 2006

The Oracle OpenWorld conference is being held, as usual, in San Francisco from Oct 22-26. This year's conference is shaping up to be a very big event with even more activities than last year.
As always there will be hands-on labs. However, this year they have all been brought together under the banner of "XTreme Weekend". This year the labs will be a lot more intense than in previous years and are intended to give delegates as much hands-on time as possible. For example for Warehouse Builder we will be providing a whole day of exercises that work through many of the new features we have added to 10g Release 2. For users more interested in reporting, this will be an excellent opportunity to get some quality time with the new BI Enterprise Edition suite of products. Full details of both tracks are below.
The labs will be staffed by product management, developers, and experienced sales consultants. So this is a great opportunity to get free advice and guidance as well as learn about the products. There will be two BI/DW tracks spread over two days (Saturday 21 and Sunday 22). There are only 75 seats available for each track and both tracks are filling up very rapidly and registration is on a first come, first served basis. Register today to attend the X-Treme program to avoid disappointment
- Oracle OpenWorld attendees: Register now for the X-Treme Weekend program for the discounted rate of $650. Register now.
- Non-Oracle OpenWorld attendees: $950. Register now.
The full details of the two BI/DW tracks are as follows:
The Leading, End-to-end Data-Warehousing Platform with Enterprise ETL, OLAP, and Data Mining Capabilities
The Oracle Database is the best platform for supporting your business intelligence applications. Oracle provides an industry leading ETL (extract, transform, and load) tool, deeply integrated OLAP capabilities, and sophisticated data mining capabilities. Join us for deep-dive BI and DW hands-on workshops that you won't find on the regular OpenWorld agenda. Here you'll learn directly from Oracle experts in the following areas:
- How to design, deploy, and manage a feature rich data warehouse environment using Oracle Warehouse Builder
- How to deliver rapid query-response times and sophisticated analysis with Oracle OLAP
- How to incorporate predictive analytics and advanced data-mining techniques into your business intelligence infrastructure with Oracle Data Mining
Next Generation Business Intelligence for Actionable Insight to Everyone in the Enterprise
In this session, you will learn how end users can construct their own queries and build their own dashboards using Oracle BI Suite Enterprise Edition. Oracle BI Suite EE lets you empower employees at all levels with the information they need to make better business decisions easily and efficiently by creating reports, charts, and performance management dashboards through drag-and-drop interface in a completely self-service, Web-based environment. Oracle BI Suite EE lets you collaborate and share business insight through email, and schedule and deliver your reports to dashboards or even wireless devices. You will also have hands-on experience in administrative tasks for defining the physical, logical, and presentation layers to define how end users will interact with the data using business terms. In this hands-on lab, you will learn how to use the components of Oracle BI EE, including Oracle BI Answers, BI Dashboards, BI Advanced Reporting, BI Delivers, and BI Server Administration. Join us for deep-dive BI hands-on workshops that you won't find on the regular OpenWorld agenda.
For a list of all the XTreme Weekend tracks (Database, Fusion Middleware, Apps) click here to go to the Oracle OpenWorld XTreme Weekend site.
Friday, July 14, 2006
Row Banding in Oracle Answers
Row banding is something that is used frequently to help make multi-row data more readable. That is a truism.
Oracle Answers (part of Oracle Business Intelligence Enterprise Edition) has support for row banding.
Here's a quick example:
This is a crosstab (called "Pivot Table" in Answers) built on the Video Stores schema. Here the report is grouped by "Region", and the measures are "Sales" and "Profit". "City" is the other item. The report is paged by "Product Description".
By default this check box is checked off. But I can check it on to enable banding. The default color here is "green bar", and the alternate banding applies only to the innermost columns. Simply speaking this means that it will apply to the non grouped items.
This should make it clearer. Region is not banded as it is a grouped item. City, Sales, and Profit are.

If I now choose the "All Columns" option from the dropdown, the banding applied is as shown below.
As you can see, even the Region column is now included in the alternate row banding.
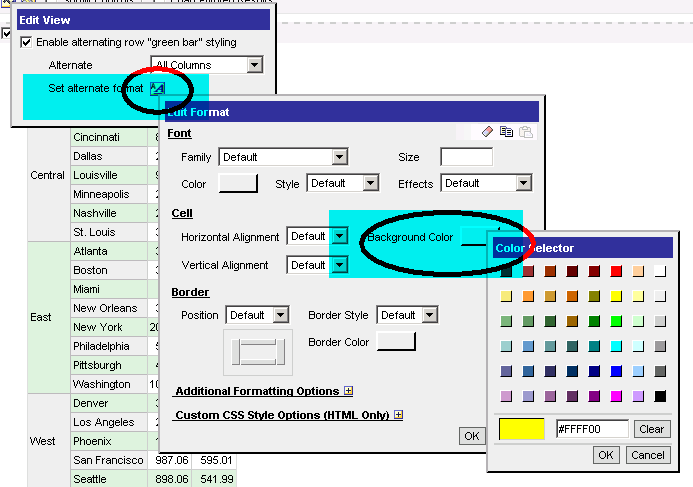
Not that I am restricted only to the light green color. I can go and set an alternate format. I select a bright yellow (would this be canary yellow? probably not... let's call it bright yellow)

Voila - here is my color banding in yellow now. Bright yellow at that.
Oracle Answers (part of Oracle Business Intelligence Enterprise Edition) has support for row banding.
Here's a quick example:
This is a crosstab (called "Pivot Table" in Answers) built on the Video Stores schema. Here the report is grouped by "Region", and the measures are "Sales" and "Profit". "City" is the other item. The report is paged by "Product Description".
By default this check box is checked off. But I can check it on to enable banding. The default color here is "green bar", and the alternate banding applies only to the innermost columns. Simply speaking this means that it will apply to the non grouped items.
This should make it clearer. Region is not banded as it is a grouped item. City, Sales, and Profit are.
If I now choose the "All Columns" option from the dropdown, the banding applied is as shown below.
As you can see, even the Region column is now included in the alternate row banding.
Not that I am restricted only to the light green color. I can go and set an alternate format. I select a bright yellow (would this be canary yellow? probably not... let's call it bright yellow)
Voila - here is my color banding in yellow now. Bright yellow at that.
Thursday, June 22, 2006
Upcoming BI releases
Got hold of shiphomes being used by QA for testing and installed them on my machine. One is the Oracle BI Standard Edition, which includes Discoverer, Discoverer OLAP, the Spreadsheet Add-In, and more, while the Enterprise Edition includes the Siebel based Analytic Server components like Answers, Dashboard, Delivers, and more. This release also has many, many enhancements that had been in the works from last year. Next month and as we get sooner to the release, I shall start posting on the install and OOTB experience. If there are specific things that people would like to see screenshots of or have me write about do let me know. Also, there is a lot of collateral, demos, white papers that are being prepared, so expect a lot of information to flow your way closer to the release date.
I now have Oracle BI 10g (10.1.2) - infrastructure and middle-tier, the latest shiphomes of BI SE and EE (10.1.3), XML Publisher, an Oracle 10.2 database, a non-Oracle database, and more on the same machine, which also happens to be my work machine. Add to it more than a gig of emails, doc for the app server, tools, and the database, work related docs, Dilbert cartoons (a healthy dose of cyncism is a sine-qua-non), and of course Google Desktop Search (which itself uses up close to 2GB of hard disk space), and I had to uninstall Oracle Database XE because I was starting to run out of disk space - I like to keep at least 6-8GB free. Having 2GB of memory certainly helps though!
See http://www.oracle.com/technology/products/bi/ for more information.
I now have Oracle BI 10g (10.1.2) - infrastructure and middle-tier, the latest shiphomes of BI SE and EE (10.1.3), XML Publisher, an Oracle 10.2 database, a non-Oracle database, and more on the same machine, which also happens to be my work machine. Add to it more than a gig of emails, doc for the app server, tools, and the database, work related docs, Dilbert cartoons (a healthy dose of cyncism is a sine-qua-non), and of course Google Desktop Search (which itself uses up close to 2GB of hard disk space), and I had to uninstall Oracle Database XE because I was starting to run out of disk space - I like to keep at least 6-8GB free. Having 2GB of memory certainly helps though!
See http://www.oracle.com/technology/products/bi/ for more information.
Monday, June 19, 2006
Small but neat feature in 'Answers'
Starting today (yes, this precise instant in time) I shall start posting on the new Oracle BI Enterprise Edition (link on OTN) product features, and here is the first post, albeit a short one.
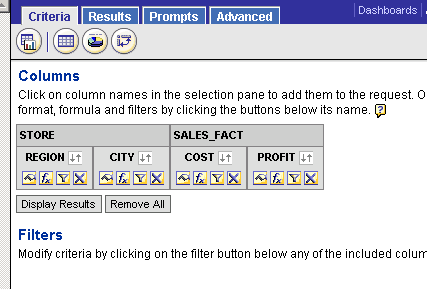
In 'Answers' (see link for an explanation for what 'Answers' is: actually, it is Oracle Business Intelligence Answers, and is the ad hoc query and analysis component of the Oracle BI EE suite), when you create a request (that would be a report / query / worksheet in Discoverer parlance, though not quite: a query is what is used to fetch data into a worksheet where it is formatted and displayed), data is automatically sorted by the first column, then the second column, and so on. Furthermore, a group sort is also applied so that i the example below the region does not appear multiple times. This report has been created from a Subject Area (think of a subject area as a Business Area in Discoverer) that is built on the familiar Video Stores dataset.
As you can see here, Region is group sorted ascending, and within each region the cities appear sorted ascending.

SELECT STORE.REGION saw_0, STORE.CITY saw_1, SALES_FACT.COST saw_2, SALES_FACT.PROFIT saw_3 FROM "Video Sales" ORDER BY saw_0, saw_1
If you click the 'Advanced' tab, you can see the SQL that is issued to the analytic server, and also the XML representation of the report (request) you are working with.
In the coming weeks and months I will also include posts on the new features in both the Standard Edition as well as the Enterprise Editions of the Orace BI Suite.
In 'Answers' (see link for an explanation for what 'Answers' is: actually, it is Oracle Business Intelligence Answers, and is the ad hoc query and analysis component of the Oracle BI EE suite), when you create a request (that would be a report / query / worksheet in Discoverer parlance, though not quite: a query is what is used to fetch data into a worksheet where it is formatted and displayed), data is automatically sorted by the first column, then the second column, and so on. Furthermore, a group sort is also applied so that i the example below the region does not appear multiple times. This report has been created from a Subject Area (think of a subject area as a Business Area in Discoverer) that is built on the familiar Video Stores dataset.
As you can see here, Region is group sorted ascending, and within each region the cities appear sorted ascending.
SELECT STORE.REGION saw_0, STORE.CITY saw_1, SALES_FACT.COST saw_2, SALES_FACT.PROFIT saw_3 FROM "Video Sales" ORDER BY saw_0, saw_1
If you click the 'Advanced' tab, you can see the SQL that is issued to the analytic server, and also the XML representation of the report (request) you are working with.
In the coming weeks and months I will also include posts on the new features in both the Standard Edition as well as the Enterprise Editions of the Orace BI Suite.
Subscribe to:
Posts (Atom)