You are taken to the Oracle BI Publisher Enterprise home page. Note that you do not have to re-login.

You can create new report by clicking the "Create a new report" and typing in the name of the report. The report is created under the current folder. You could always go and create a BI Publisher report against any supported data source, and that now includes RSS feeds also (have to check if that's been available before 10.1.3.2 also...). But in this case I shall create a report that goes against the BI Answers presentation layer.


If I click the "Edit" link for the report (see the list of links available - "View", "Schedule", "History", "Edit", "Configure"), it takes you to the page where you can edit the report, and change such things as the report's data source, data model, add/remove templates, etc...
Note below that there is a new "Data Source" available, named "Oracle BI EE".

That is the data source I shall use. Click the "Query Builder" button and it takes you to BI Publisher's "Online Query Builder". From the top right hand drop down I can select from either of the two subject areas available to me: "Paint" or "Paint Exec". The list of (logical) folders is based on the schema I select, in this case "Paint".
I can drag and drop any folder to the 'canvas', and check/uncheck the fields that I want included in my report. Note that I do not have to specify any joins here, as the BI Analytic Server shall take care of resolving any joins.

Click on the "Results" link, and the results of the query are fetched.

Click the "Save" button and you see the "SQL Query" field updated with the sql for the report. At this point, you can upload a template if you have one available, or use the "Oracle BI Publisher Template Builder for Word" to create a (or more than one) template and associate it with the report. That is a topic for another post, another day.
Also, there is the other side of this integration, which is the fact that you can publish BI Publisher reports to Interactive Dashboards. That also, I shall post soon.

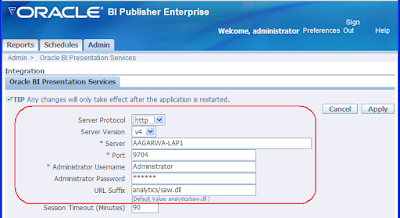
To take a peek at how this integration has been done, click the "Admin" tab. On the Admin page, at the bottom you shall see a section named "Integration". "Oracle BI Presentation Services" is the link that you use to configure BI Publisher to integrate with Oracle BI Presentation Services.

The page shows you all the details - if you install Oracle BI EE using the complete install option, these values are filled in by the installer. Else you can always go back and add/change them.

Related posts:
- BI Enterprise Edition - First Look - Post Install
- Oracle BI Enterprise Edition - First Look - Instal...
- BI EE 7.8.5.2 also available
- BI EE 10gR3 - Go Get the software
- Online tutorial for BI EE
- BI EE Documentation now available
- Gartner Research Note on BI
- Oracle a leader in latest Gartner BI Platform Magi...
- Announcing Oracle Business Intelligence Enterprise...