Pages

Showing posts with label D4O. Show all posts

Friday, July 20, 2007

Petrol and OLAP

According to this NYT article (Big Rise Seen in Demand for Energy - New York Times), "It started with a simple question by Samuel W. Bodman, the energy secretary: What does the future hold for supplies of oil and natural gas?".
In order to answer this question, the National Petroleum Council developed an analytic data warehouse using Oracle relational and OLAP technology. Implemented by Vlamis Consulting, the NPC report states:
The data warehouse was designed to be the main analytical tool for the Task Groups, accepting all data collected from the survey questionnaire and other data sources. As the survey data were multi-dimensional, Oracle OLAP database technology was used and the collection was organized using 7 dimensions:
1. Time (year)
2. Geography (country or geographic region)
3. Energy type (e.g., Oil, Gas, Coal, Nuclear, Renewable)
4. Energy sector (e.g., Commercial, Residential)
5. Case type (e.g., Business as usual, Alternative energy policy)
6. Units (applicable unit of measure)
7. Source (e.g., Public, Proprietary)
The statistics contained in the report posed interesting technical challenges, including non-additive data, skip-level hierarchies, non-standard aggregation rules, and more - all of which Oracle OLAP is designed to manage. Discoverer OLAP was used to analyze the data.
You can find more on the Vlamis blog here (Vlamis Software » Blog Archive » Vlamis Used Oracle OLAP For National Petroleum Council Study)

Thanks to Marty Gubar from OLAP Product Management for passing this on.

Thursday, December 01, 2005

Multiple Conditional Formats on the same item

During a presentation today, I realized I didn't about this cool feature in Discoverer 10.1.2 till our UI and usability expert pointed it out.
When applying conditional formats in Discoverer (OLAP), you can have more than one conditional format active for a given item. As long as they do not overlap, they keep getting applied to the item, which means each successive format simply applies itself over and above the previous formats.

I always find it better to explain things using images and screenshots. So if you have understood what I am saying, the screenshots below are quite tautological.

Take this worksheet I have created in Discoverer Plus OLAP. Quite straightforward; I have two measures - Costs and Sales, and one calculation - Margin.
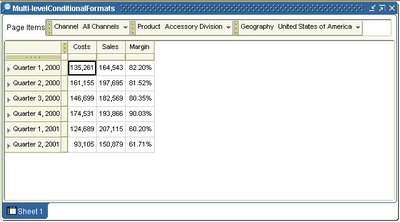
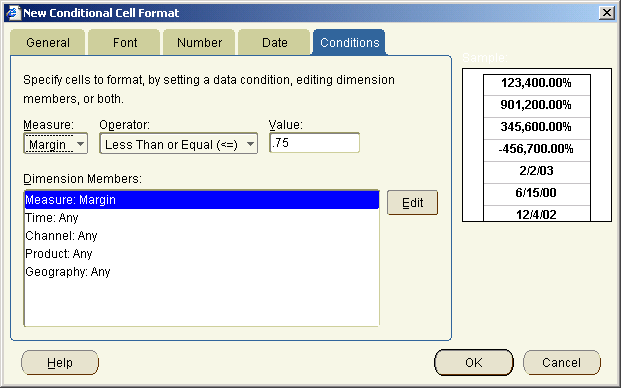
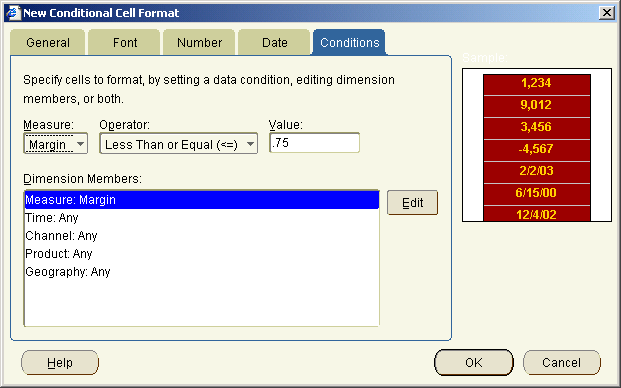
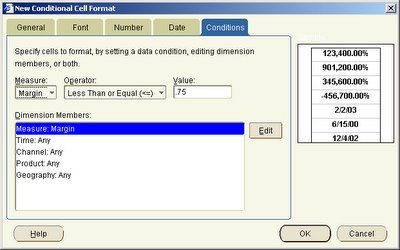
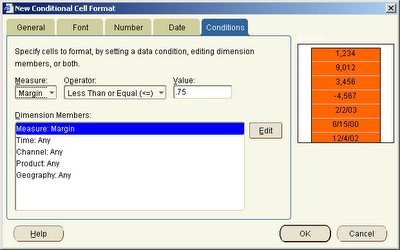
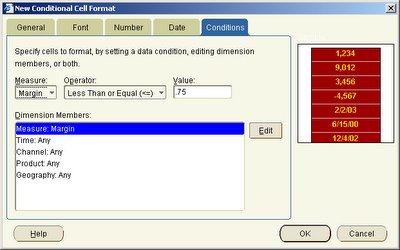
I now start applying a series of conditional formats to the 'Margin' calculation. Each format has the same condition, for simplicity: "Margin Less Than or Equal to 0.75" (i.e. 75%). For this first format, I simply state that the item should be formatted bold. The preview pane at the right shows me how this format would look like.
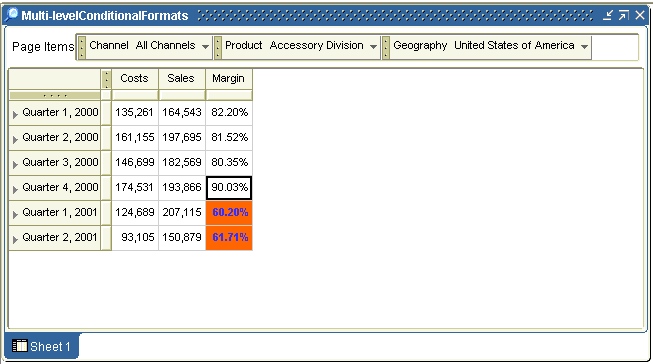
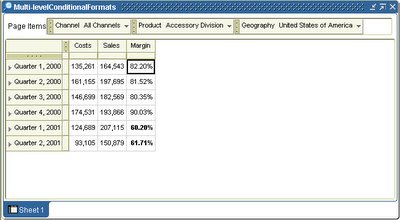
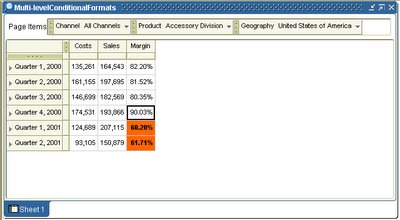
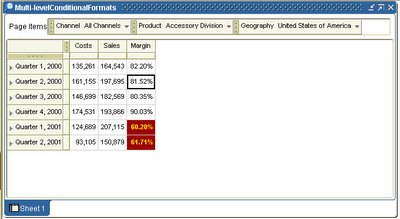
And this is how my worksheet looks like. Note that two cells in the 'Margin' column are now bold highlighted, corresponding to 'Quarter 1, 2001', and 'Quarter 2, 2001'.
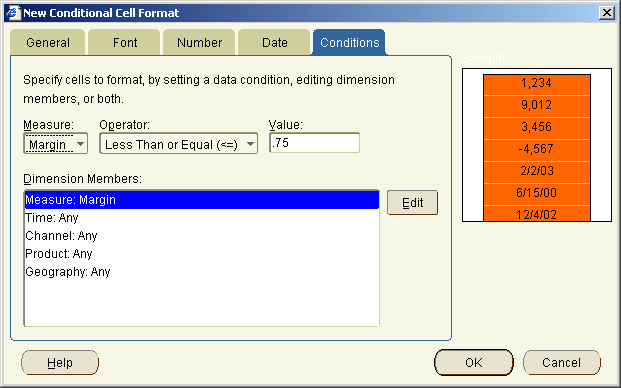
The second conditional format I apply is to format such cells (as meeting the "Margin Less Than or Equal to 0.75" condition) with a background of 'orange' (hex color code FF9900).
This background color format does not conflict with the earlier defined format, so all cells matching the condition get a background color of orange.
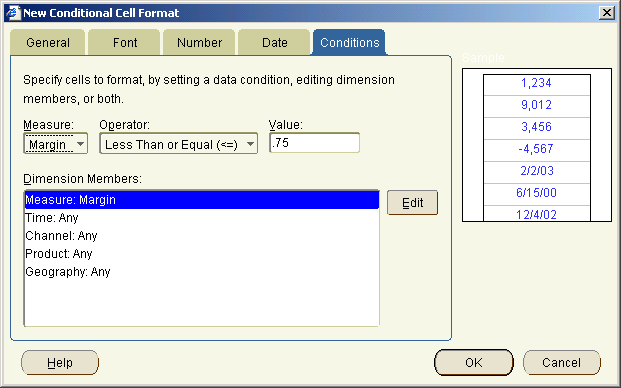
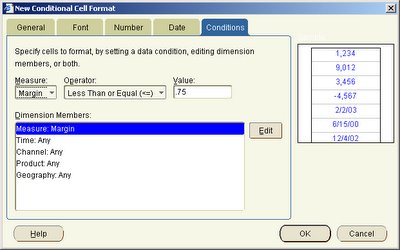
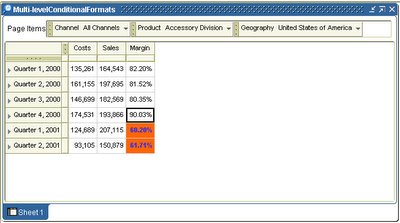
And finally I add a third conditional formt, with the same condition, but a different format. The font color is now set to be blue whenever the condition evaluates to true.
So now you can see below all three conditional formats existing in harmony, as none of the formats conflicts with the other.
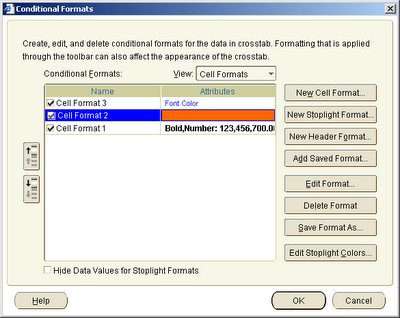
If you now take a look at all conditional formats (Format --> Conditional Formats), you shall see that all my three conditional formats are active.
Let's now define a new conditional format, on the same item, that actually conflicts with an existing format. So, the fourth format I define still has the same condition (), but a format that conflicts with earlier formats: a cell background color of red and a foreground color of yellow (color:#FFCC00;background-color:#990000)
As I can see, this format now takes precendence over earlier defined conflicting formats.
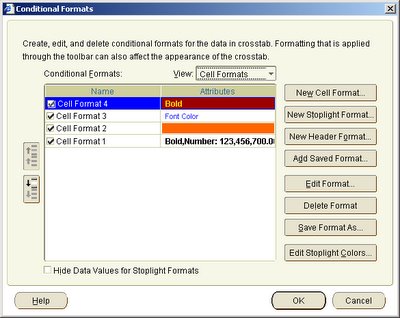
See the Conditional Formats list, and you will see that while all earlier formats for the item are still active, the last conditional format defined takes precedence, and hence conflicting formats are suppressed.
Wednesday, August 31, 2005

Some Discoverer OLAP - D4O - queries answered

This is in response to a recent comment left behind by Anand in response to my post - "OLAP 10g R2 web seminar"

The answers here have been provided by Keith Laker (you may already know him from the BI Beans OTN Forum)

1. Does D4OLAP supports the attribute reporting?
OLAP currently supports dimensional selections based on attribute members. If you have an attribute called "Product Color" you can select all products where color is red. If you want to include the values of Product Color in your report you need to either add Product color as a dimension or as a measure (which would allow you to include product color in the databody of the report)

2. How do we do the Dimension based measures calculations (E.g.. ratio of Sales Value by Discount Value (where discount and sales are transaction type dimension members across value measure)) ?
The calculation templates provided within Discoverer, Excel, BI Beans are designed to provide the most commonly used calculations in an easy to use wizard. However, the OLAP engine supports many more functions, such as forecasting. Customers can also create their own functions to generate specific types of calculations using the extensive library of OLAP DML commands and associated functions. The easiest way to create this specific type of calculation is to use Analytic Workspace Manager and create the calculation definition directly within the AW.

3. How do we use the Parameters in OLAP reports?
OLAP Parameters are not supported within Discoverer in the current release. However, if you do need to create a specific report that does require parameter support you can access an Analytic Workspace using SQL via the OLAP_TABLE function. This would allow you to create relational queries against AW cubes. However, you would lose the multi-dimensional query model, therefore, I would only recommend this approach for use with specific types to reports that do not require detailed analysis by end-users.

4. Need to review the YTD function to check if the calculation is proper.
Not sure what the question is? If the customer wants to see the SQL generated by OLAPI the answer is we do not expose our SQL statements. If you want to ensure the data is correct, and that the calculation is actually performing the correct aggregations, then you could use AWM and compare the results from an OLAP DML report to the values in your report. However, I can assure you the calculation syntax for YTD is correct - assuming you have the correct time based metadata available. This is covered in the OLAP database documentation.

My note: Users are more likely to get answers by posting such queries to the appropriate OTN Forum. So do feel free to leave feedback, but for detailed responses like this, your best bet should still be the OTN Forums: