Pages

Thursday, December 29, 2005

How Do You Debug OLAP DML from BI Beans?

Most BI applications simply provide read-only views on business data. However, some users do actually need to interact with data to perform data modeling and/or forecasting scenarios. Oracle’s OLAP environment provides an extremely rich and secure environment for providing this type of interaction. In a previous article in the Oracle magazine I explained how you to build a JSP page that allowed a user to select different types of forecasts. However, since SQL does not currently provide forecasting I used the multi-dimensional programming language OLAP DML, which is very similar to SQL.

In the process of creating this sample I discovered a number of issues that lead to some new features within BI Beans 10g. Most of the issues of combining server side programming (OLAP DML) with JSP development is actually debugging the whole stack. JDeveloper provides excellent JSP debugging tools and the JDev team have some excellent samples that can be found on their OTN home page.

However, trying to debug OLAP DML was not quite as easy. So as part of BI Beans10g we provided some additional debugging facilities to help OLAP DML developers. A generic AW is used to debug any OLAP DML operation that is called from a JSP page. This AW is shipped as part of the Common Schema samples and is usually installed into the CS_OLAP schema and is called AWDEBUG. It contains a program that controls the whole debug process, called BI_BEANS_UTIL. That program takes the following arguments:

  • Context Name passed from Java Environment
  • Current directory setting
  • Name of calling program
  • Mode of operation - START or STOP
  • Should prgtrace be enabled
  • Should badline be enabled
  • Should monitor be enabled
  • Should trackprg be enabled
The AWProgram JSP tag controls many of these arguments. The JSP tag has properties that allow the developer to control which of the features are enabled or disabled.

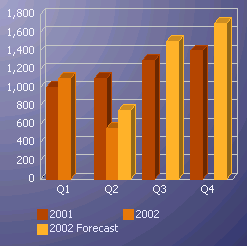
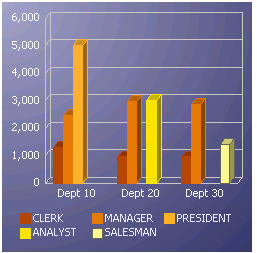
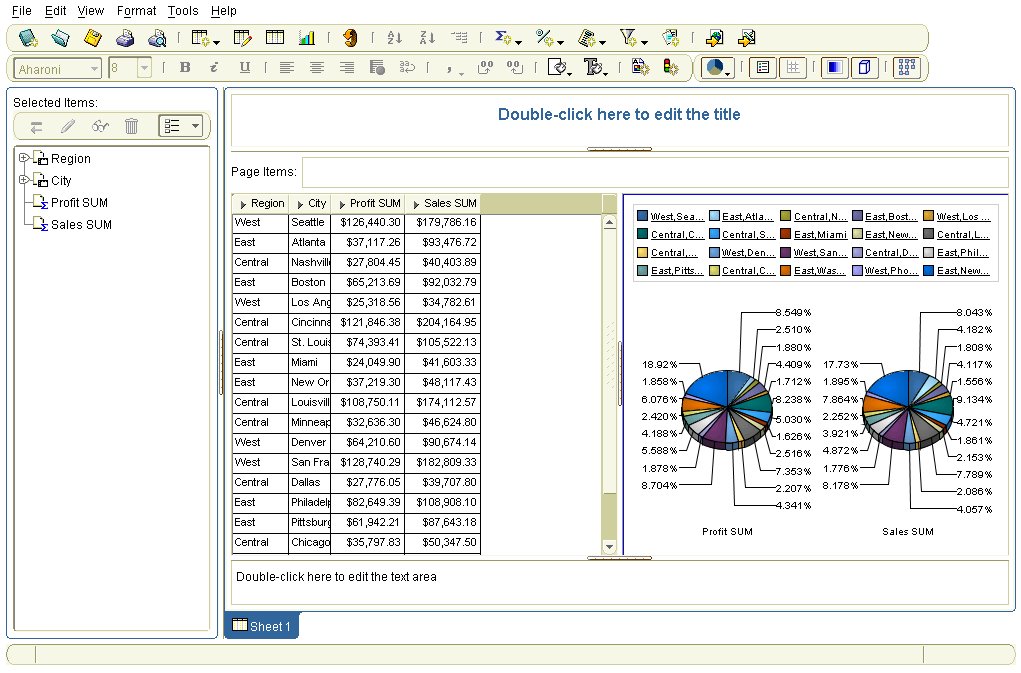
To show how the debugging process works lets review the What-If JSP page that is part of the Executive Insight demo. The page contains two buttons above the bar graph:

  • Run Model – executes a new forecast using the OLAP DML program RUN_MODEL
  • Reset – clears forecasted data using the OLAP DML program CLEAR_DATA

To enable the debugging process the AWDEBUG workspace needs to be attached to the current session. This is done using an AWCommand tag. The tag is added to the start of JSP page and is set to manually execute. Other options are “onRender” or “onInit” and these are self-explanatory.


The wizard that defines the tag allows the developer to type any OLAP DML command into a window. These are the commands that will be executed when the tag is called.


For this example, we attach the AW UTILS that contains the programs that will create the forecast data and also remove the forecast data for the “Reset” button. The second command attaches the AW that controls debugging.

The next step is to add the two buttons that will execute the OLAP DML and update the graph with the new data. These buttons can be defined using the AWProgram JSP Tag. The tag wizard prompts for the required inputs. The key fields are as follows:


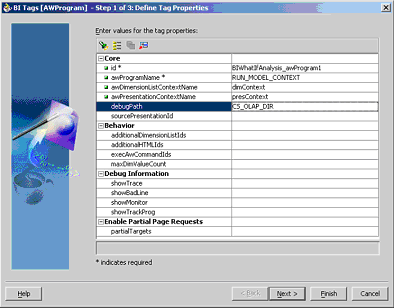
  • debugPath – this is the name of a directory object created within the database instance and points to a directory path on the server. All trace files will be written to this directory
  • ShowTrace – enable trace of each line of code. This sets the OLAP DML option called PRGTRACE. This generates a file called program_name_PRGTRACE_timestamp.trc
  • ShowBadLine – enables verbose error messages
  • ShowMonitor – enables recording of execution timings of each line of code. This generates a file called program_name_MONITOR_timestamp.trc
  • ShowTrackprg - enables recording of execution timings of each program. This generates a file called program_name_TRACK_timestamp.trc

Each file is written to the directory specified in the debugPath property. All tracing is enabled only for the duration of the execution of the tag. Once the tag has finished firing all tracing is automatically disabled.

The three files that are generated contain different information and are used to debug different situations. Once an OLAP DML program has been defined the next step is to ensure it is executing correctly. The execution path can be traced using the showTrace property. This will show, line by line, the flow of the program. Assuming the program is running correctly but performance is not as expected you can use the showTrackprg and showMonitor properties to evaluate how much time is being spent within each program and on each line within each program. This can highlight lines of code that are taking a long time to execute and that need optimizing. I will provide a detailed review of each of these trace files in the next article.

Thursday, December 22, 2005

Standalone Discoverer 10g (10.1.2.0.2) clients now fully SSO compliant for E-Business Suite users

This announcement just came in from the Applications Technology group, that does the certification of Discoverer releases on E-Business Suite versions (among a lot and lot of other things).

I am reproducing it verbatim below:

ANNOUNCEMENT
Standalone Discoverer 10g (10.1.2.0.2) clients are now fully Single Sign-On-compliant for E-Business Suite users.

E-Business Suite end-users who access E-Business Suite workbooks via standalone Discoverer 10g clients no longer need to dual-maintain user credentials in both Oracle Internet Directory and FND_USER.

With this upgrade:
  • Users may access E-Business Suite Discoverer workbooks via Discoverer's Connection Manager feature from standalone Discoverer clients, with user credentials managed in Oracle Internet Directory (NEW)
  • Users may access E-Business Suite Discoverer workbooks via E-Business Suite menus via E-Business Suite Home Page
  • Users may access E-Business Suite Discoverer workbooks via Oracle Portal and the E-Business Suite Applications Navigator and Applications Favorites portlets
Supported Platforms
  • Sun Solaris
  • Linux
  • Microsoft Windows
HP/UX and AIX support for this configuration is not yet available. The documentation will be updated as soon as those ports are released.

For More Information
For full details, see Metalink Note 313418.1 (December 2005 version).

The note is titled "Using Discoverer 10.1.2 with Oracle E-Business Suite 11i", and has a Last Revision Date of 21-DEC-2005
Try this URL to directly access the note (you may be asked to login to Metalink first).
Also note, that the announcement above is meant to be shared with customers, lest you think I am divulging confidential info ;-)
Finally, please refer to the Metalink note for clarifications - I won't be able to provide you with answers in any great level of depth here.

Monday, December 19, 2005

UIX Hack 4 - Removing the worksheet breadcrumb

A Discoverer forum post on OTN last week asked how to remove the had a query on how to remove the worksheet breadcrumb from the Viewer page. You cannot do that by using the Viewer customizations feature available from the App Server Control (see Section 9.2 - Customizing Discoverer Viewer - of the Oracle® Business Intelligence Discoverer Configuration Guide, 10g Release 2 (10.1.2.1) for Microsoft Windows and Solaris Operating System (SPARC), Part No. B13918-03, link to doc on OTN). You can however do a lot of other customizations to the layout, and the look and feel.

To remove the breadcrumb, you have to get your hands dirty with UIX (see links to previous posts on UIX and UIX hacks in Discoverer at the end of this post).

Before I get into what is required (and it is really quite simple), I must warn you on two points:
  • Such hacks are not supported and not encouraged. Why? Because Oracle Support will insist you reproduce any problem you have with your Discoverer installation WITHOUT these hacks. You cannot call/contact Oracle Support for any, and I repeat ANY, issues you may run into as a result of using these hacks. These hacks are not fully tested, nor are they guaranteed to work on all combinations of platforms. Any upgrade or patch you may apply to your Discoverer installation will most likely overwrite these customizations. And finally, because we do not guarantee that we will continue to use UIX in future releases. So any effort you expend into gaining UIX expertise for the purposes of Discoverer customizations may likely be useless in the future.
  • Ok, I only had one point, albeit a long-ish point. Well, no! I do have a second point!!. The second point is that if you do create an unsightly furor over any problems with UIX hacks, I shall get into trouble, and shall most certainly be proscribed from writing on these hacks.
Ok, I have carried out my duty about warning you in letter and spirit. Let's move on with the hack now, shall we?

The offending breadcrumb in question is shown below, circled in red.
To remove this, you need to edit a UIX file. The file is located under the following folder: C:\ias\j2ee\OC4J_BI_Forms\applications\discoverer\discoverer. c:\ias is the folder on my machine where Discoverer is installed. Under this folder is a file named 'Worksheet.uix' (intuitive, isn't it?). First, make a backup of this file. Which can be as simple an operation as doing a copy-and-paste if you are using Microsoft Windows. Once this backup has been made, open the worksheet.uix file using a text editor like Notepad, vi, TextPad, etc...
Browse down the file till you find the line that starts with <breadCrumbs rendered=...
Select this line, and delete all lines starting with this line till the line that starts with </breadcrumbs>, including this last line also. Save the file, re-start your OC4J_BI_Forms instance, and re-start Viewer. You should not see the breadcrumb any longer.

An alternative, and a simpler alternative at that, is to find the line that says:
<breadCrumbs rendered="${uix.eventResult.notPortalMode}">
Change this to:
<breadCrumbs rendered="false">
Save the file, re-start your OC4J_BI_Forms instance, and re-start Viewer. You should not see the breadcrumb any longer.
If things didn't blow up to high heaven, the breadcrumb should no longer be visible.
Related UIX Hacks posts:
http://oraclebi.blogspot.com/2005/08/uix-hack-1-removing-connect-directly.html
http://oraclebi.blogspot.com/2005/09/uix-hack-2-remove-last-refresh-date.html
http://oraclebi.blogspot.com/2005/09/uix-hack-3-removing-type-column-from.html

From detail to summary in two clicks

My heart leaps up when I behold a crosstab... (to mis-quote Wordsworth). Imagine being able to tell your users that you can take about a quarter million cells of data, and summarize them into nine cells! Of course the assumption being that your data is amenable to that kind of extreme summarization. A picture being worth a thousand words I shall demonstrate, and illustrate, with screenshots. (I have never really tried to test that theory out.... is it really worth only a thousand words? Do you need a really large picture? Is there a formula that you can use to convert pixels into words? You get the drift; this can meander into a really exciting debate, one that I am not too inclined to enter, just not yet.)

Take the screenshot below. It is a table. It shows Profit, Sales, and Unit Sales data at the detail level. I.e. it shows data at the transactional level. I have included only the 'Region' level of the geography dimension. There are only three regions in my data set: East, Central, and West. Which is why these members repeat many, many times. But each row represents a transaction. And I have more than 87,000 transactions. This is a lot of data. You can imagine the excitement if this were to be a few million, billion rows. How do you make sense of this data? Or more precisely, how do you start to make sense of this data?
One way to do is to summarize this data. And if you are using Discoverer, you can summarize this data in about three clicks . How? Simple. From your menu click the arrow to the right of the 'Add Worksheet' icon (that would be the sixth icon in the Discoverer toolbar).
Or you could use the menu and select 'Edit' >> 'Duplicate Worksheet' >> 'As Crosstab'.

Up pops a screen where you can adjust the layout of your crosstab.
Click the 'OK' button and there you go! Nine cells of data. Profit, Sales, and Unit Sales have been summarized for each of the three regions.
Simple, yet powerful (or is it powerful, yet simple?). Discoverer has had this capability for many, many releases now. Yet, as I read and scout the web for news and views, I hear that there are vendors that are aiming to bring out similar functionality only next year, or the year after next. How original.

Tuesday, December 06, 2005

PDF Settings in Viewer

One post on the Discoverer OTN Forum (link to Discoverer OTN Forum) recently asked how to persist PDF settings in Viewer. I realized that today we do not persist these changes, neither across sessions or users, nor within the same session. Which can be a bummer at times. For example, what happens if I have a wide worksheet, and I want to not only change the print orientation from portrait to landscape, but also apply a scaling factor to the text size? Sure, I can do that by going to the Printable Page link and make the required changes here. However, if I want to email the same worksheet as a PDF attachment, or maybe take a PDF export of the worksheet, I lose those settings. Now, of course we shall provide a way to persist these settings across a session or even across users in the next release, but what about now? Well... I went over to our Viewer expert, Matthew, and of course there is a way!

The short one line explanation of the workaround is to make the changes using the 'Printable Page' link, generate a 'Preview' or the entire PDF report, and then use the worksheet breadcrumb link to return to the worksheet. This ensures that the PDF changes you made are available during the sesion to the worksheet. You can always undo these settings by clicking the 'Revert to saved' link.

Let's see with an example, and lots and lots of screenshots!

This is a slightly modified version of the 'New Features Examples' workbook that ships with Discoverer. As you can see, the worksheet is 'wide' - it has three measures, and three members of the geography dimension laid out on the row edge, resulting in nine columns of data.
If I generate a printable PDF sample from this report, you will see, unsurprisingly, that the some columns of the report spill over to the second page.
If I want to get them to fit on one page, I have a couple of options available. I could go to the 'Printable Page' screen, and change the paper orientation from 'Portrait' to 'Landscape', and also set a scaling factor of 50%.

With these settings, the resulting PDF generated (using the Printable Page option) now fits on a single page, width-wise. And as you can see, the text size also looks a lot smaller (should be 50% of the original size, but I have not tested that).

Now, click the worksheet link at the top of the page (Connect > Workbooks > Viewer Print Test - Conditional Formats > ) to return to the sheet. The PDF settings that you applied are now available within this session to the worksheet. Therefore, you can now click the 'Export' link and select PDF as the export format.
The exported PDF file has the same settings applied: paper orientation as well as the scaling factor.
You can also test this out with the email option; select PDF as the format to email the report as, and click the 'View attachment' button at the bottom of the 'Send Email' page.

Voila! PDF settings are available here also!

You could close this worksheet, open another worksheet or even another workbook. So long as you don't exit Viewer and remain in the same session, the PDF settings that you applied earlier using the Printable Page options shall be available to the worksheet.

Thursday, December 01, 2005

Multiple Conditional Formats on the same item

During a presentation today, I realized I didn't about this cool feature in Discoverer 10.1.2 till our UI and usability expert pointed it out.
When applying conditional formats in Discoverer (OLAP), you can have more than one conditional format active for a given item. As long as they do not overlap, they keep getting applied to the item, which means each successive format simply applies itself over and above the previous formats.

I always find it better to explain things using images and screenshots. So if you have understood what I am saying, the screenshots below are quite tautological.

Take this worksheet I have created in Discoverer Plus OLAP. Quite straightforward; I have two measures - Costs and Sales, and one calculation - Margin.

I now start applying a series of conditional formats to the 'Margin' calculation. Each format has the same condition, for simplicity: "Margin Less Than or Equal to 0.75" (i.e. 75%). For this first format, I simply state that the item should be formatted bold. The preview pane at the right shows me how this format would look like.
And this is how my worksheet looks like. Note that two cells in the 'Margin' column are now bold highlighted, corresponding to 'Quarter 1, 2001', and 'Quarter 2, 2001'.
The second conditional format I apply is to format such cells (as meeting the "Margin Less Than or Equal to 0.75" condition) with a background of 'orange' (hex color code FF9900).
This background color format does not conflict with the earlier defined format, so all cells matching the condition get a background color of orange.

And finally I add a third conditional formt, with the same condition, but a different format. The font color is now set to be blue whenever the condition evaluates to true.
So now you can see below all three conditional formats existing in harmony, as none of the formats conflicts with the other.
If you now take a look at all conditional formats (Format --> Conditional Formats), you shall see that all my three conditional formats are active.

Let's now define a new conditional format, on the same item, that actually conflicts with an existing format. So, the fourth format I define still has the same condition (), but a format that conflicts with earlier formats: a cell background color of red and a foreground color of yellow (color:#FFCC00;background-color:#990000)
As I can see, this format now takes precendence over earlier defined conflicting formats.

See the Conditional Formats list, and you will see that while all earlier formats for the item are still active, the last conditional format defined takes precedence, and hence conflicting formats are suppressed.

Wednesday, November 30, 2005

Discoverer Is Not Supported On XE

I wanted to clarify one issue here, explicitly. Discoverer and the Oracle Database 10g Express Edition (aka XE) are not supported. I realize that it may appear to some people that because Discoverer relational works on XE (with the exception of some functionality) and because I, as an Oracle BI PM have been posting about this to the whole world, that there is some official sanction to this. That is not the case. Discoverer and XE are not supported.

Using BI Beans with non-OLAP data source

One of the largest threads currently running on the BI Beans forum relates to using BI Beans with non-OLAP data sources. Out of the box most of the BI presentation beans are wired to work with an OLAP data source. That OLAP data source can be derived from either a relational star/snowflake schema or an analytic workspace. The use of an OLAP data source against a relational schema requires additional metadata to be added in the form of registration of dimensions and cubes within the CWM repository.

In many cases the creation of this additional metadata may not be possible, so people have asked if it is possible to connect BI Beans to a non-OLAP data source. The answer is yes. The easiest way to do this is to use the BI Graph bean and connect this to an XML data source. This is relatively easy to do and as part of the BI Beans 10g samples we already provide a UIX example that shows how to connect a BI Graph bean to an XML data source. Now we have added a JSP example.

Using a very simple JSP page we can add a new BI Graph bean and render this with data from an XML data source. The code below shows the completed JSP page with all the require libraries and tags:


In this example the JSP page includes two key lines of code:

Line 1: helper.setGraphProperties(graph, "graph1.xml");
Line 2: helper.loadData(graph, false);

The first line sets the style properties for the graph. Below is the code used to load the style information and apply it to the graph:


For more information on setting the various graph properties and styles using the XML tags please refer to my previous posting “Beyond the BI Graph”. This can be found at the following URL:

http://oraclebi.blogspot.com/2005/11/beyond-bi-graph-wizard.html

The second line of code creates a connection to a non-OLAP data source for the graph and is contained within the same code library as the previous, code extract, GraphUIXSample.java. The loadData() method allows for two different types of connections. By passing the value of “false” as the last parameter the graph will be generated using data from an XML file, "helper.loadData(graph, false); ". This will call the following code:


This code loads an XML file that contains the following tags and data points:


which results in the following graph being displayed when the JSP is run:


By passing the value of “true” as the last parameter ( helper.loadData(graph, true) )the graph will be generated using data from a SQL statement. This will call the following code:


For this example we connect to the Scott schema and select data from the EMP table. The connection details to the instance are coded into this example; however, these could be stored and loaded from another file if required. Note here the lack of a BIDesigner connection, this is an area that also generates a lot of questions on the forum. There is no need to define a BIDesigner to make a non-OLAP connection. The connection is defined as per a normal ODBC connection.

The SQL statement is contained within a String object and is defined as follows:

String sqlQuery = "select DEPTNO, JOB, avg(SAL)from EMP group by DEPTNO, JOB";

Executing the query in a SQLPlus session will generate the following result:


The query results are assigned to an array called “data” using a “while” loop to walk-through the result set. To assign the data to the graph the setTabularData() method is called:

graph.setTabularData(data);

Running the JSP page now will generate the same style of graph as before, however, the data will now be sourced from the EMP table and will appear as follows:


Expiration of scheduled workbooks

Here is a short example of how scheduled workbooks in Discoverer expire. Consider the example below where I have scheduled a workbook to run every 1 minute. Also, I have specified that the results should be deleted after 1 day.
In theory, I should have at most 24 x 60 = 1440 results for this given workbook available. Well, I was not about to wait one whole day, so I did the next best thing. I simply reset my machine's clock forward by one day, restarted my middle-tier services (actually only the process manager: OracleasProcessManager in my case), reconnected to Plus, and launched the Discoverer Scheduling Manager. Now, my system clock said something like Nov 30, 2005, 4:15pm. Therefore, all results from Nov 29 that had run before 4:15pm should have expired. If you take a look at the screenshot below, it will confirm the same: four results have expired and will be deleted.

Results of scheduled workbooks are stored in tables in the EUL. This means that for every run of a scheduled workbook, one table is created in the EUL. If you were to list all the tables in the EUL, prior to deleting the expired results, you get 62 results.
Exit Discoverer Plus, and you are prompted with a dialog asking you to confirm the deletion.
Click 'OK' and the results are deleted. Which means that four tables sould have been deleted from the EUL. To confrm that, rerun the SQL command to list all the tables in the EUL (select tname from tab;). As expected, the EUL now has four tables less than before.
You could try different options, but the bottom line is that the results become due for expiration and thus deletion when they are more than 24 hours old in this case.

Monday, November 14, 2005

Oracle XE Database and Discoverer - 3 - Opening and Creating Workbooks

So far I have covered installing the XE database on a Windows 2000 machine (see link to earlier post on the topic), and connecting Discoverer Administrator to the XE database to create an EUL and import the Video Stores tutorial data (see this link to an earlier post on creating an EUL on an XE database).

In this post I cover (briefly) connecting Discoverer Plus relational to the EUL. I used the connect directly option in the Discoverer connections page to connect to the 'AA' EUL hosted on the XE database. After Plus launched, I verified that I was indeed connected as user 'AA' against an XE database to the 'AA' EUL. The reason I verified this every time connected is because I have three databases running on my laptop: a 10.1.0.4 infrastructure database, another 10.1.0.4 database for OLAP (I don't want to use the infrastructure database for OLAP, even though it is an enterprise edition version with OLAP, Data Mining, and Partitioning options available), and now the XE database (10.2.0.1). It would do me no good if I made a mistake when entering the connection details and ended up connecting to one of the other two databases (my tnsnames.ora file has entries for all three databases).

Having verified that Plus was connected to an XE database ("Oracle Database 10g Express Edition" to be propah), I now wanted to see if I could create a simple report, then proceed to create some analytic calculations, share the workbook, schedule it - basically do some basic sanity testing. Oh, and yes, open the workbook in Viewer, and go through the typical steps that a user would go through.
A simple tabular report with Region, City, Profit and Sales turned up nicely. A multi-pie chart added to the appeal!
On to creating an analytic calculation. Here is the first analytic calc being created - a rank of cities by Profit. The calculation itself is:
RANK() OVER (ORDER BY Video Analysis Information.Profit SUM DESC)
Discoverer itself would not perform this calculation: it would simply include the sql in the worksheet SQL and pass it to the database. Therefore, if this worked, it would mean that XE was also able to compute SQL analytic functions.

Added a second calculation for share of Sales by city for all regions, added a stoplight format each to the two analytic calculations, edited the sheet title, renamed the sheet, saved it, re-opened it, and everything worked like clockwork!
Also opened the worksheete in Viewer, made some layout changes, saved the changes back, and re-opened the worksheet in Plus.
Here is the actual SQL that Discoverer generated:
SELECT o100027.CITY as E100123,o100027.REGION as E100155,RANK() OVER(PARTITION BY ( GROUPING_ID(o100027.CITY,o100027.REGION) ) ORDER BY ( SUM(o100026.PROFIT) ) DESC ) as C_2,SUM(o100026.PROFIT) as E100153_SUM,RATIO_TO_REPORT(( SUM(o100026.SALES) )) OVER(PARTITION BY ( GROUPING_ID(o100027.CITY,o100027.REGION) ) ) as C_1,SUM(o100026.SALES) as E100161_SUM,GROUPING_ID(o100027.CITY,o100027.REGION) as GID
FROM VIDEO5.SALES_FACT o100026, VIDEO5.STORE o100027
WHERE ( (o100027.STORE_KEY = o100026.STORE_KEY))
GROUP BY GROUPING SETS(( o100027.CITY,o100027.REGION ),( o100027.CITY ))
HAVING (GROUP_ID()=0)
ORDER BY GID DESC;
For readability, I copied this, removed a couple of items, and ran this on my XE database using SQL*Plus:

SQL*Plus: Release 10.2.0.1.0 - Beta on Mon Nov 14 12:41:42 2005

Copyright (c) 1982, 2005, Oracle. All rights reserved.


Connected to:
Oracle Database 10g Express Edition Release 10.2.0.1.0 - Beta

SQL> SELECT
2 o100027.REGION as Region,
3 o100027.CITY as City,
4 RANK() OVER(ORDER BY ( SUM(o100026.PROFIT) ) DESC ) as Profit_Rank,
5 SUM(o100026.SALES) as Sales FROM VIDEO5.SALES_FACT o100026,
6 VIDEO5.STORE o100027
7 WHERE
8 ( (o100027.STORE_KEY = o100026.STORE_KEY))
9 GROUP BY o100027.CITY,
10 o100027.REGION
11 ORDER BY
12 o100027.REGION ASC
13 ;
REGION CITY PROFIT_RANK SALES
-------------------- ------------------------------ ----------- ----------
Central Cincinnati 4 204164.95
Central St. Louis 8 105522.13
Central Chicago 14 50347.5
Central Minneapolis 15 46624.8
Central Louisville 5 174112.57
Central Nashville 16 40403.89
Central Dallas 17 39707.8
East Atlanta 13 93476.72
East Boston 9 92032.79
East Philadelphia 7 108908.1
East Washington 6 175790.69

REGION CITY PROFIT_RANK SALES
-------------------- ------------------------------ ----------- ----------
East New Orleans 12 48117.43
East Pittsburgh 11 87643.18
East Miami 20 41603.33
East New York 1 396408.26
West Los Angeles 19 34782.61
West Phoenix 18 42363.74
West Denver 10 90674.14
West Seattle 3 179786.16
West San Francisco 2 182809.33

20 rows selected.

SQL>
So far, I have not found anything that hasn't worked on XE; but then again, I have not tried out a whole lot of things that depend on functionality that may not be available on XE. Partitioning for one is not available on XE, nor is Data Mining and OLAP functionality. More in the next post.
Related posts:
  1. Oracle XE Database and Discoverer - 2 - Creating the EUL
  2. Oracle XE Database and Discoverer - 1 - Installing XE