Pages

Tuesday, December 26, 2006

Misc links for the year

To end a particularly slothful last few months as far as posting goes, I have as (possibly) my last post for the year with a few links to Oracle related posts:
The next year should be different - with more posts and more bloggers. At least that's my hope.

Warm wishes to everyone for a very happy 2007.
Before I sign off for the rest of the year, I am off to complete two documents on what I know are going to be blockbuster features in Oracle BI when they are released.

Saturday, December 16, 2006

Embedding video on this blog

Ok, so it is late at night here, Saturday morning, and in the true spirit of weekend craziness, I thought let me try and posting some video content to this blog. Not just any video content, but a small Flash based file. To keep things simple for me, this is a short video of the Oracle BI Spreadsheet Add-In, but with no explanatory text or commentary. And it is very, very short.


Update: it's taking a bit for the video to be processed on YouTube... shall check in the morning, and if it still hasn't processed...

Announcement: Oracle Data Mining Consultants Partnership Program

The Oracle Data Mining Technologies blog has this post for those in the data mining field:
We're starting a program to work with qualified data mining consultants.

You and your colleagues are invited to participate in a 2 day hands-on session designed for data mining consultants here in the Oracle Burlington MA office February 7 & 8, 2007. Space is limited, so please RSVP asap.

The Oracle Data Mining Consultants Partnership Program has been established to develop a support network of skilled data mining consultants. As part of this program, we're looking to promote knowledgeable, skilled data mining experts who can leverage Oracle's in-database functionality. Consultants that demonstrate proficiency in Oracle Data Mining and working in Oracle-centric environments will be promoted within Oracle Sales via eSeminars, web directories, user organizations, and face to face meetings.

See this link for more details.

Thursday, December 14, 2006

Discoverer 10.1.2.2 Patchset for Linux

Search for Patchset Id 4960210.
It's now available on the following platforms:

  • Linux x86
  • Microsoft Windows (32-bit)
  • Solaris Operating System (SPARC 64-bit)

So the new thing is that Linux has been added. This became available a day back - Dec 12 2006 - and is 1.7GB in size (1,803,762,801 bytes). Happy downloading.

Wednesday, December 13, 2006

Differences between Plus, Viewer, Desktop

Michael Armstrong has a post on the differences between the different components of Discoverer - Desktop, Plus, and Viewer. Actually the post is itself a link to a short document written by a prolific
member of the OTN forums - Russ Proudman. See this link for the actual article.

The table of differences has some errors - that I am more than happy to point out :) The first "yes/no" is for "Desktop", the sec0nd for "Plus", and the third for "Viewer". Also, these comments are based on a very quick pass of the list, so I may have missed some errors out...
  • View Query With Snapshot Data No No No - I don't know what Russ means by "snapshot" data, but you can have Discoverer run off scheduled workbooks, so this line is not entirely correct then.
  • Deliverable As Portlet No No No - every Discoverer worksheet can be delivered as a portlet; the component - Desktop, Plus, Viewer is irrelevant here.
  • Apply Parameters To Worksheet Yes Yes No - of course parameters can be applied to Viewer, or am I missing something here?
  • Save The Workbook Yes Yes No - worksheets can be saved in Viewer also (shall provide a link in the next post).
  • Export To XML ? Yes ? - Is available in Viewer.
  • Export To PDF No Yes ? - is available in Viewer.
  • Drill To Link No Yes ? - is available in Viewer. In Desktop you have the ability to do hyperdrills, so I would say you can do drills in Desktop also.
  • Cascading Parameters ? Yes ? - available in all three components.
  • OLAP Support No Yes ? - available in Viewer also.
  • Command Line Interface Yes No No - there is a EUL Command Line utility available, so this functionality is pretty much platform independent. The component inclusion is not relevant here.
  • Graph Types No Yes Display - you can change the graph type, sub-type, hide the graph, view the graph, and change other properties like size, 3D effect...
  • High fidelity printing via PDF No No Yes - of course you have hi-fidelity printing in Plus. Also, you have export to PDF, which is the same as PDF printing...
  • Stoplight Formatting Display Yes Display - escapes my mind for Viewer. Shall check on this.
  • Interactive Pivoting No Yes No - yes!!! This is present in Plus as well as Viewer.
  • Choose which worksheet to open before opening workbook No(5) No(5) Yes - you can do this in Plus. You can expand the workbook to see the worksheets there, and then select a specific worksheet to open. The default behavior if you select the workbook and click 'Open' is to run the last saved worksheet.
  • Ability to schedule and export in one step - only in Desktop using command line interface and a third-party scheduler Yes(9) No No - shall be available very soon in Discoverer. Watch this space!
  • Export Crosstab to Excel pivot table - this is available in Plus and Viewer.

Monday, November 20, 2006

Analytic Applications - BI Apps - Documentation


It's probably been there a while now, but I just noticed that the doc library for "Oracle's Siebel Business Analytics Applications Version 7.8" (now renamed Oracle BI Applications) is now available on OTN here - http://www.oracle.com/technology/documentation/bi_apps.html

There are PDF download links for "Analytics Applications Installation and Administration Guide (7.8.4)", Analytics Applications Upgrade Guide (Version 7.8.4)", "Customer-Centric Enterprise Warehouse Installation and Configuration Guide", and a "Bookshelf for Siebel Business Analytics Applications Version 7.8.3"

Thursday, November 16, 2006

Oracle named Technology Partner of the Year by SPSS

This from Bill (William) Nee from the Oracle Database product marketing team:

Last week SPSS held their Directions User Conference in Chicago. During the conference it was announced that Oracle had been named the SPSS "Technology Partner of the Year". The award was given to Oracle for its joint work with SPSS in building integration between SPSS Clementine and Oracle Data Mining.
This integration allows analysts to use the Clementine interface to build, browse and score models in Oracle Database 10g using techniques available with Oracle Data Mining. ODM algorithms, including Naïve Bayes, Adaptive Bayes Network and Support Vector Machines, appear as "nodes" in the Clementine interface. These techniques can then be used just like the other techniques that are native within Clementine.

Visit the Oracle page on the SPSS site at http://www.spss.com/clementine/oracle.htm

Wednesday, November 08, 2006

Discoverer 10.1.2.2 patch available

The Oracle Application Server 10g Release 2 (10.1.2) Patch Set 2 (10.1.2.2.0) is now available for download from Metalink (https://metalink.oracle.com/).

This includes many features in Discoverer, primarily in the OLAP area.
The patch number is 4960210. It is currently available on Microsoft Windows (32-bit) and Solaris Operating System (SPARC 64-bit). Other platforms will become available shortly.
If you see the readme file, section 9.5.3 covers "New Features for Oracle Business Intelligence".

This is a list of new features in the release, from Table 10 of the readme file:

  1. Calculated Members
  2. Write-back
  3. Graph Styles
  4. Discoverer Catalog Support
  5. Share Calculations and Saved Selections In a Workbook
  6. Toolbar
  7. Floating OracleBI Query Editor
  8. Enhanced Refreshing of Queries
  9. VBA Macros

These new features span Discoverer Plus, Plus OLAP, Viewer, Portlet Provider, and the Spreadsheet Add-In.
Look for more posts on these features. Here is a list of some posts by Aneel and me on some of the new features in the "calculated member" release:

  1. Spreadsheet Add-in - Refreshing multiple queries
  2. Spreadsheet Add-In - non modal wizard
  3. Rename queries in Spreadsheet Add-In 10.1.2.2
  4. New Graph styles in the upcoming Discoverer release

Thursday, November 02, 2006

Blog Stats

Knowledge is power, or - "gyanadheenam jagat sarvam" - as the Sanskrit phrase (almost) similarly states. Whether the knowledge that 100 or 1,000 or 10,000 people visit the BI blog everyday is power that I can utilize is something debatable. Whether it is even 'power' of any kind is also a question.

Sometime back I had wondered (link to blog post) about a sudden spurt in traffic to the blog. Now, blogging (work related as well as personal) is pretty much a non-monetizable activity (my compensation, reviews, and performance objectives are in no way tied to the popularity of this blog, though some may want to try and establish a negative correlation between the two), yet I do have some amount of interest in seeing that this blog gets more visitors than less.

Someone suggested I turn to Google Analytics to find out why or at least "who".
Google Analytics and StatCounter both provide lots of useful statistics. I personally find StatCounter to be more user-friendly, but Google Analytics lets me look at statistics over longer periods of time, not restricting me to only the last 100 hits for detailed info.

These then are screenshots from reports I ran using Google Analytics on the BI blog on such topics as browsers, platform, geographies, screen resolution, etc...

Unsurprisingly so, the dominant platform for visitors to this blog is Windows (96%+), followed far behind by Macintosh, Linux, and Sun OS.


When it comes to browsers, Firefox has a share (30%) disproportionate to its overall share (which hovers around the 10-12% mark). Along with Internet Explorer (64%), these two browsers pretty much are it. Opera, Safari, and others are far behind.


The situation is slightly more varied when you combine browsers with platforms; it is apparent that Windows XP is the most popular OS for visitors to the blog.
Various versions of IE & Firefox on XP made up 75% of the traffic. I was surprised to see both IE7 and Firefox 2 (neither of which were officially released till a few days back) make up more than 5% of the traffic.


No surprises here - almost every browser was Java enabled.


32 bit color is the standard - wonder if people really don't know they can switch down to 16 bit color (and thereby improve performance, if only a wee bit), or that graphics memory is now available in hundreds of megs for people to not really care (I have seen some new desktops at work with something like 200 megs of video memory!).


Everyone has Flash installed - even the latest versions: 8 and 9.


Even with large monitors, widescreen monitors, the screen resolution of choice for almost half the visitors remains the trusty 1024x768. 1280x800 seems to suggest a widescreen monitor. 1440x900 is an odd size...


Of the 119 countries that this blog has seen hits from, more than half come from the US (38%) and UK (12%). Only India (8%) and Australia (2%) are the non North American or European countries in the top 11 list.

And here is the complete list of 119 countries (in alphabetical order):
Albania, Algeria, Andorra, Angola, Anonymous Proxy, Argentina, Aruba, Asia/Pacific Region, Australia, Austria, Azerbaijan, Bahrain, Bangladesh, Barbados, Belarus, Belgium, Bolivia, Bosnia and Herzegovina, Botswana, Brazil, Bulgaria, Cameroon, Canada, Chile, China, Colombia, Costa Rica, Croatia, Cuba, Cyprus, Czech Republic, Denmark, Dominican Republic, Ecuador, Egypt, El Salvador, Estonia, Europe, Faroe Islands, Fiji, Finland, France, Germany, Ghana, Greece, Guatemala, Honduras, Hong Kong, Hungary, Iceland, India, Indonesia, Iran, Ireland, Israel, Italy, Jamaica, Japan, Jordan, Kenya, Korea, Kuwait, Latvia, Lebanon, Lithuania, Luxembourg, Macedonia, Malaysia, Malta, Mauritius, Mexico, Moldova, Morocco, Nepal, Netherlands, New Caledonia, New Zealand, Nicaragua, Nigeria, Norway, Oman, Pakistan, Panama, Paraguay, Peru, Philippines, Poland, Portugal, Puerto Rico, Qatar, Romania, Russian Federation, Satellite Provider, Saudi Arabia, Senegal, Singapore, Slovakia, Slovenia, South Africa, Spain, Sweden, Switzerland, Syrian Arab Republic, Taiwan, Thailand, Trinidad and Tobago, Tunisia, Turkey, Uganda, Ukraine, United Arab Emirates, United Kingdom, United States, Uruguay, Uzbekistan, Venezuela, Vietnam, Yemen, Yugoslavia

More than 2,300 cities!

Friday, October 20, 2006

Oracle and Informatica extend agreement

Ok, so I do have one more post before the weekend.
There is a news story (link), "Informatica and Oracle Renew OEM Partnership",that "extends the companies' existing OEM agreement for four years".

When Siebel had first introduced in 2004 its "cross-enterprise, prebuilt applications beyond the traditional legs of CRM, sales, service and marketing. The new tools move into financial analytics, workforce/employee performance management and supply chain, and supplier analytics." (see news story), they had "teamed with Redwood City, Calif.-based Informatica Corp. to provide an interface to a range of enterprise applications such as SAP, PeopleSoft and Oracle."

As an aside, Informatica is headed by Sohaib Abbasi (link), an ex-Oracle senior vice president, and who was my boss's boss's boss's boss's boss (I think, or maybe a couple of more bosses removed) when I joined Oracle in 2002.

Portlets with many rows

In a galaxy far, far away, during a time long, long back (in Bangalore, and on Aug 10 2005 actually), one of my first posts when I started the Oracle BI Blog was "Why You Should NOT Publish Large Worksheets to Portal".

This, then, can be seen as a followup post to that one.
Here, I show how it is possible to increase the number of rows that you want displayed in a Discoverer portlet in Oracle Portal.

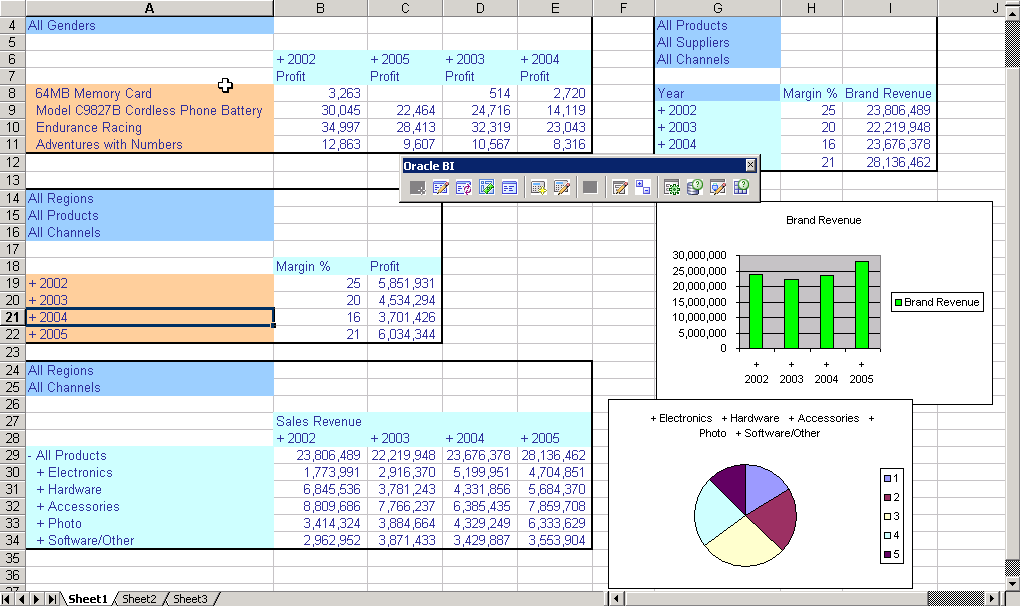
As is my preference, I shall let the pictures say the thousand words (which, btw, if you were to try and apply to a data warehousing world, would be woefully inadequate... anyway - I digress).

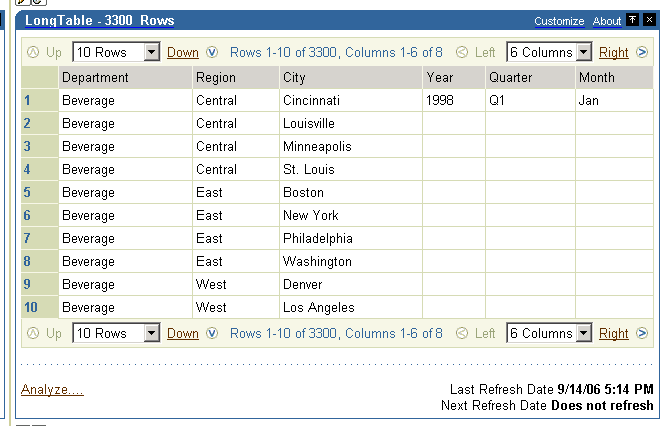
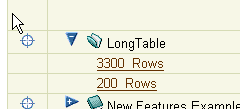
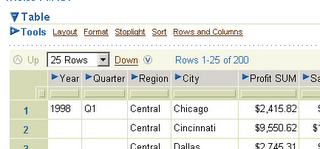
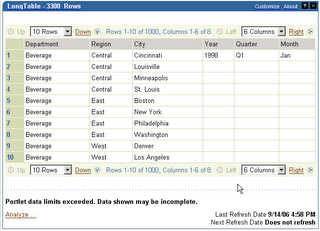
I have a workbook called "Long Table", which has two worksheets. "200 Rows" returns only 200 rows, while "3300 Rows" returns surprise, surprise, 3300 rows (see the screenshot below).


So, if I publish both worksheets to an Oracle Portal page, I find that the "200 Rows" worksheet portlet displays without any problem. You can also notice the text next to the page drop down that says that you are viewing "Rows 1-25 of 200"'.
With the long table however, I have a problem. Since the default limit on the number of rows for a Discoverer portlet is 1000, there is an error text at the bottom of the portlet that says "Portlet data limits exceeded. Data shown may be incomplete".

The remedy is simple, though not something I would advise you pursue in haste.
If however you do want to do that, then, do this:
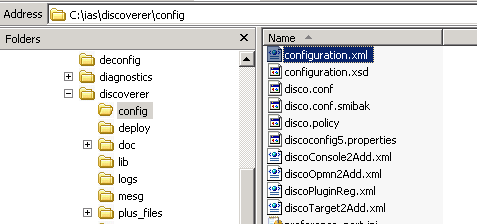
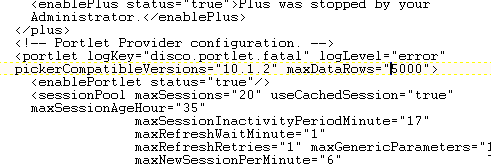
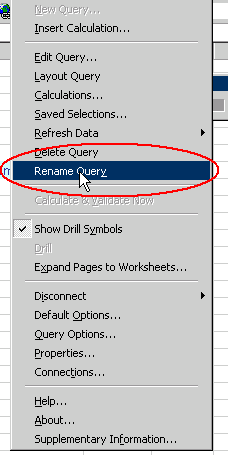
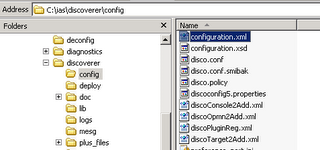
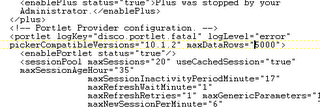
In the Oracle home where Discoverer has been installed - in this case it is "C:\ias", go to the discoverer/config folder, and locate the "configuration.xml" file.
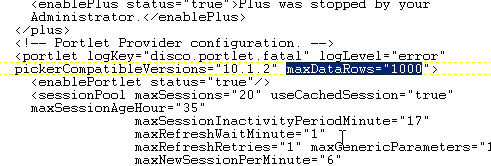
Locate the lines that say maxDataRows='1000'.

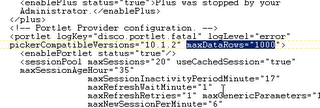
Change it to some other value - in this case I changed it to 5000. Not advisable, I repeat, but the gun's in your hands, as are your feet, and I am only helping you point one in the direction of the other.
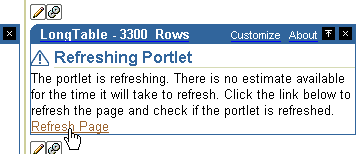
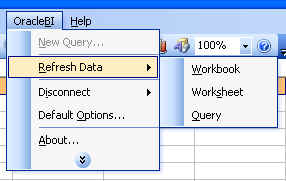
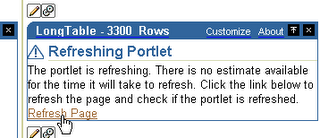
Restart your OC4J BI Forms service, reconnect to Oracle Portal, and refresh the portlet. I need to do that because when publishing the portlet I had specified that I never wanted to refresh the portlet.


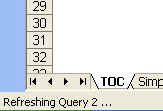
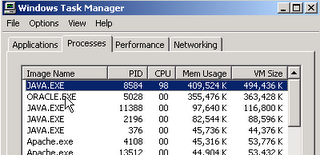
While it is refreshing, and since it has to do the 'things' to process several thousand rows of data, it takes bit. If you see your task manager, you shall find that memory and cpu usage are not pretty sights. Therefore, another reason not to raise these limit values indiscriminately (have I said before that's not such a good idea?).
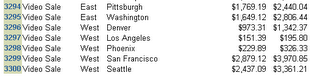
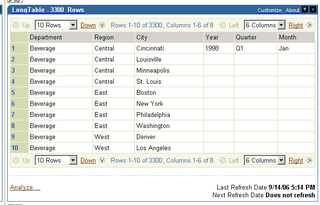
Anyway, once the portlet has refreshed, the long one mind you, you shall see that (i) it now says it is indeed capable of displaying the last row of data in the table (the 3300th row), and (ii) there is no error message at the bottom of the portlet saying that not all data was retrieved, because all data --was-- fetched.

And that's my last post for the week; I wish you a very happy Diwali, and see you in a bit.
Mike Durran shall be talking about and showing a very nice, useful, and frankly a very darn cool Discoverer feature that we have been working on for some time now. After his session is over (that would be next Thursday), I shall post more on that feature here.

Update: I forgot to add - thanks to Chandan for helping me with the information in this post.

Tuesday, October 17, 2006

IDC Ranks Oracle No 1 in Business Analytics

According to this IDC report - "Worldwide Business Analytics Software 2006-2010 Forecast and 2005 Vendor Share" - that is also available on Oracle.com here (PDF), Oracle has been ranked #1 in the overall business analytics category.


View this blog in multiple languages

Thanks to the Oracle Data Mining Technologies blog, I have added links to this blog to allow you to view it in different languages - the translation is provided by Google.com

Wednesday, September 27, 2006

Spreadsheet Add-in - Refreshing multiple queries

This is a commonly requested new feature in the upcoming OracleBI Spreadsheet Add-in 10.1.2.2.
A new menu option now makes it easier to work with workbooks that contain more than one query.

As you might know, it is possible to create more than one query in a worksheet in a workbook. Each query can have it's own connection, so it is even possible to run against more than one database from within one workbook or worksheet!
Of course, if you have multiple queries, you might want to reconnect/ refresh them all in one step. This new feature in version 10.1.2.2 does exactly that.

When you open a workbook with multiple queries, you now have following menu options available: OracleBI->Refresh data, then Workbook, Worksheet or Query.


If you pick Workbook or Worksheet and multiple queries are involved, the login dialog will be displayed. It might be displayed multiple times, if the queries have different connections.
Once you have typed in username/ password, the add-in will loop through all the queries, and reconnect/ refresh the data.

In the lower left corner you will see a message on the status bar, that will display the name of the query being refreshed. As Abhinav mentioned, you can now rename queries, so instead of seeing "Refreshing Query 2..." you might see "Refreshing Sales Query 2006..." and so on.


Tuesday, September 19, 2006

Why Is the blog getting so many hits

Assuming that Statcounter has not gone crazy, I have seen a surge in hits to the BI blog (not seen since Tom Kyte linked to this blog when it was launched - see his post). See the chart above and you can see that the average traffic to the blog has basically more than doubled, without any seemingly obvious explanation... So while I am certainly not complaining, and while I wish I had a thousand dollars for every hit (yes - I would rather not wish for pennies and get even less - as long as I am wishing let's make it count, in the rather remote possibility that it actually comes true), I would like to know what's driving the traffic. Statcounter won't collect details on more than a 100 hits at a time, so that doesn't help either. Hmm... maybe Google Analytics!

Some blog stats

Following up on my last post ("Why Is the blog getting so many hits"), and in response to William Robertson's comment, here are some stats from StatCounter.
As you can see, a lot of links are coming from Google, so looks people are searching for stuff, and finding the blog appear on the search results, and find their way here.
For example, if you search for "oracle business intelligence", while the first couple of results are from Oracle.com, the third hit is from the BI Blog.
Also, Mark Rittman's blog is a popular blog that people come from.
At the risk of extrapolating the last 100 hits to be representative, it seems that more and more hits to the blog are coming from searches. Though I can't figure out just how someone searching for "dog food bar graphs" landed on this blog! Search and you find that this post is the culprit, and that too it is the second search result!
The home page of the blog is very popular, and now the last post too...

Spreadsheet Add-In - non modal wizard

Short post before I get to work (am visiting Oracle at Redwood Shores in the US this week, so thanks to jet lag, getting in to work by 7AM is a breeze!).

One of the many improvemnents in the area of usability to the upcoming release of the Oracle BI Spreadsheet Add-In (10.1.2.2) is in the ability to work with your query editor wizard while making changes to your spreadsheet. In the current release of the Add-In the query editor is modal, so that once you launch it, you cannot go back into your sheet and make any formatting changes etc...

This mode of using the query wizard is not enabled by default. To enable it, you have to go to the Add-In default options screen, to the 'General' tab, and check the option that says "Keep Query Editor visible while query is active".
Once you do that, the next time you launch the query editor wizard (edit the query, add a calculation, change the layout, add a saved selection (more on that later - yes, you can now add and save and reuse saved selections from your Discoverer D4O catalog!! Yippee!), etc...) a smaller sized query editor is launced, placed at the right bottom corner of the Excel window.
Even while the query editor is active, you can drill (I drilled into Q1 of 2005), or select cells and apply a format, even as you change your query layout, or add/remove items, etc...

Pretty nice, eh?

Monday, September 18, 2006

Oracle Discoverer at OpenWorld

Thanks Abhinav for that welcome to the Oracle BI Blog.

By way of introduction, I've been at Oracle for nearly 10yrs - in fact, it will be almost 10yrs to the day while at OpenWorld. I can safely say that no two days have been the same and it is still an exciting place to work.

I started out in BI consulting and worked on various projects implementing relational data warehouses, and OLAP systems using the Express multi-dimensional data base - this was mostly for Sales Analyzer implementations. I also started using the Discoverer 3.0.7 limited production release. The great thing about working on BI projects is that you get to learn about a lot of different industries and I found myself working in banking, telecomms, travel and the pharmaceutical industry. I made the move into BI product management 6yrs ago. Prior to Oracle, I completed a PhD in computational chemistry.

Finally, I'd like to mention my upcoming session at Oracle OpenWorld. I'll be talking about Discoverer Futures around three key themes:

- Protecting existing Discoverer investments
- Extending Discoverer functionality
- Integration with the OracleBI Enterprise Edition

If you are attending this years OpenWorld, then please come along and say 'Hi'. My recommendation is to book your place at any sessions you are interested in well in advance. I know that mine is already half-full. See you in October!

Mere Paas BI Hai

Ok, so most people not crazy about Hindi movies will miss this post's title (translated, it means "I have BI"). For some background see this Wikipedia post (link to entry).

Anyway, the recent issue of Intelligent Enterprise has this Oracle BI ad on the back cover.

Sunday, September 17, 2006

Welcoming Mike Durran as the new BI blogger

Welcome Mike Durran, Discoverer and BI product manager, based out of Orace's Bristol development center in the UK, and the latest to join the BI blogworld!

Thursday, September 14, 2006

X-Treme at Oracle OpenWorld

X-Treme Program at Oracle OpenWorld 2006Keith and I have blogged about the upcoming Oracle OpenWorld conference (link to page on Oracle.com) in San Francisco next month (Oct 22-26 2006).
This year, the X-Treme program (link) offers highly technical, deep-dive content through a series of intense breakout sessions and X-Treme hands-on workshops. It covers twelve tracks on various topics including business intelligence. The BI track (link) shall cover Oracle BI Suite Enterprise Edition (link to product page on OTN). There, "you will learn how to use the components of Oracle BI EE, including Oracle BI Answers, BI Dashboards, BI Advanced Reporting, BI Delivers, and BI Server Administration. Join us for deep-dive BI hands-on workshops that you won't find on the regular OpenWorld agenda."

This is an awesome way to learn more about the products and meet the people behind the products (except me, I shall not be attending OpenWorld this year big grin). You get to meet the product experts, and get to hear from them about the current product release, upcoming releases, roadmap, and more. Of course there are many regular conference sessions, presentations, and keynotes that shall cover this, but at the X-Treme program you get to meet the product experts even before the conference begins (remember, the X-Treme session starts on Oct 21 and end the next day on Sunday, Oct 22).

Click on the banner above or click this link to learn more about and register for X-Treme.
Here is a link to all the special programs on offer at this year's OpenWorld.

Wednesday, September 13, 2006

Rename queries in Spreadsheet Add-In 10.1.2.2

This is the new version of the Oracle BI Spreadsheet Add-In (link to OTN) that is due out shortly. Aneel Shenker, fellow product manager and responsible for the Spreadsheet Add-In, posted a blogpost a while back introducing the new Add-In (link to post).
I finally got round to installing the latest internal build (see screenshot) and playing around with it a bit. The install process is as easy as it was before. Since the Add-In runs on Excel, and since Excecl is available only on Windows, the installer also is a native Windows installer that does its job in less than a minute.
One specific feature I shall look at in this post is the "Rename Query" feature.

Look at the screenshot of a query I have in Excel that connects to an Oracle Database 10.2.0.2 Analytic Workspace. By default the name given to BI queries in an Excel workbook are "Query n", where 'n' keeps incrementing by 1 whenever you add a new query to the sheet. As you would suspect, lots of scope for making it more usable - especially if you happen to have several queries in your sheet. And that is exactly what we have done in this update.
A new menu option has been added to the Add-In menu in Excel, called "Rename Query". So, if you want to rename "Query 1" to something else, like "Yearly Measures", then simply type in the new name, click 'OK' and you are done.

A small dialog pops up that lets you enter in a more user-friendly, descriptive name for the query. In this case I decide to name it "Yearly Measures". Click 'OK' and go back to the AddIn menu dropdown and select "Properties".

To verify that the name change has been effected, click the "Properties" menu option from the Add-In menu, and the new name will be visible.

So, to take this example below, where on a single sheet I have four BI queries, the three that I added later all have the generic name:

After renaming the three queries, I now have usable, intuitive names for all my BI queries: