Pages

Friday, August 31, 2007

Learning more about BI Publisher - OBE

If you want to quickly learn about or get a feel for how BI Publisher works, and this may be especially the case for those who come more from the Discoverer side of things, I would suggest you spend a few minutes going over the excellent OBEs (Oracle By Example) series available on BI Publisher on OTN.
The Oracle by Example (OBE) series provides hands-on, step-by-step instructions on how to implement various technology solutions to business problems. OBE solutions are built for practical real-world situations, allowing you to gain valuable hands-on experience as well as use the presented solutions as the foundation for production implementation, dramatically reducing time to deployment.

The BI Publisher OBE page lists these OBEs:
While these OBEs are based on the 10.1.3.2 release of BI Publisher, it doesn't matter for the most part - there are some new features in BI Publisher that you could read up on separately; enhancements to the Template Builder, support for digital signing of PDF files, support for Flash as a report format, etc...

Also, you can probably skip the second OBE for now, but it is still useful as it gives a glimpse into how you could integrate Discoverer content with a BI Enterprise Edition Dashboard page.

Thursday, August 30, 2007

BI Publisher Discoverer Integration - 4 - getting the software

After the grand success of my first three posts on BI Publisher and Discoverer integration (BI Publisher Discoverer integration, BI Publisher Discoverer integration 2, and BI Publisher Discoverer Integration - 3) I considered retiring and moving to a life of book tours and guest lectures. Then I thought of something better - why not a fourth post. Well, why not? And mind you the thought was merely rhetorical (कभी कभी मेरे दिल मे ख़याल आता है - kabhi kabhie mere dil me khayal aata hai). So here goes.

This post describes how to get the Discoverer patch that contains the secret sauce that makes the magic of Discoverer web services come alive.

Since it is a bit late at night here, and I have to complete a document this week (preferably tonight), and since I have been making very little progress, I want to get this post done quickly, and also with the hope that writing this post will get me back into the groove of writing the bit that remains in the other document.

Let's get the simple stuff out of the way:
This integration is available in the 10.1.3.3.0 release of BI Publisher (Download the software - home page, or download the standalone version of BI Publisher for Windows or Linux). You can read 10.1.3.3 is now available for more information on 10.1.3.3.0. I shall describe the details of the integration in a future post; for now let's just focus on getting the software.

For the Discoverer bit, you need to have Oracle Application Server 10gR2 (version 10.1.2.2) installed. That's mandatory, no getting round it. Then, you need to download a patch, a Discoverer specific patch that contains the BI Publisher integration code. Actually it is the code that exposes certain functionality via SOAP based web services, but since this code was built primarily for the reason of integrating BI Publisher and Discoverer, we have been calling it the 'XMLP web services' - which is horribly wrong for at least two reasons: (i) the correct product name is 'BI Publisher', 'XML Publisher' was the old name, and certainly calling it 'XMLP' is a no-no, and (ii) these are not 'xmlp web services', these are Discoverer web services. But you know what I am talking about, right?
So where was I? Web services patch. Right. You can download the patch from Metalink (http://metalink.oracle.com/). Good. Can I go? May I go? I forgot to mention some specifics, didn't I? The devil is in the details, as they say.

Ok. Let's do it in a cleaner, more 'brevitous' manner, shall we?
- Download and install Oracle Application Server 10gR2 (version 10.1.2.2).
- Choose the 'BI & Forms' type install.
- Verify that Discoverer is working.
- Go to Metalink and search for all patches for 'Discoverer Plus or Viewer' for 'iAs 10.1.2.2'.
- Select patch '5648158'; the one that says 'Merge XMLP API to Main' (see what I said about using non-standard abbreviations externally?)
- Download it.


The 'Advanced Search' screen for patches on Metalink


The Discoverer web services patch


The patch download page

Bye...?
No?

Ok, just one more bit that I have to tell you.
The patch is password protected.
You need to get the password from your support analyst.
The support rep shall provide you with the password.
The support analyst shall first verify with you that you really need the patch and that you are not mistaking the patch for something that it's not (turn-by-turn instructions on how to get to Jhumri Tilaiya).

It (the patch) is a 12MB zip file for both platforms (Windows and Linux).

Tuesday, August 28, 2007

BI Publisher Discoverer Integration - 3

So far I have blabbed blogged two posts (BI Publisher Discoverer integration and BI Publisher Discoverer integration 2) on the BI Publisher and Discoverer integration in the BI EE 10.1.3.3 release.
In the second post I took a Discoverer worksheet and showed a barebones BI Publisher report created using that worksheet as the data source. No layout, no template, but showed glimpses of what is possible here.

This, the third post, goes a bit further, wherein I focus on the basics and show how you can take a single Discoverer worksheet and from it create multiple tables, charts, crosstabs, totals, etc... Basically to showcase one of the benefits of this integration and of the capabilities of hi fidelity layouts that BI Publisher enables. For specifics and details on BI Publisher I would suggest going to OTN and going over the excellent documentation (PDF User Guide, or HTML version), OBEs (Oracle By Example), the BI Publisher blog, or the other training material available from Oracle University.

Let's start from the beginning, a very good place to start.
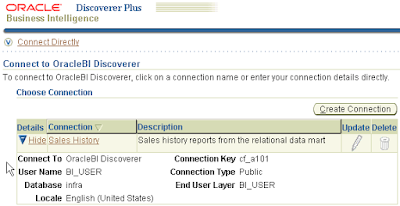
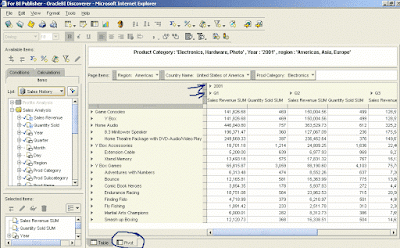
Using a public connection ('Sales History' - as in based on the SH schema), I have created a Discoverer workbook, which has two worksheets in it. One worksheet is a table while the other is a crosstab (pivot table).


The table and pivot table are identical as far as the items go - both have the same items (fields if you will) on them, and both have the same parameters in use.


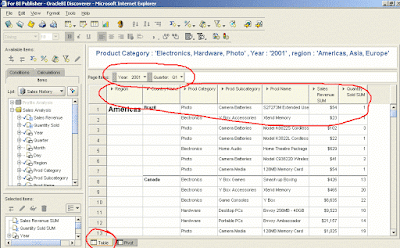
There is a parameter on 'Product Category', on 'Year', and one on 'Region'. The 'Year' parameter accepts only single values, while the other two parameters can accept multiple values - that is the way I have defined the parameters sir, not that 'Year' is any snootier than the other parameters.


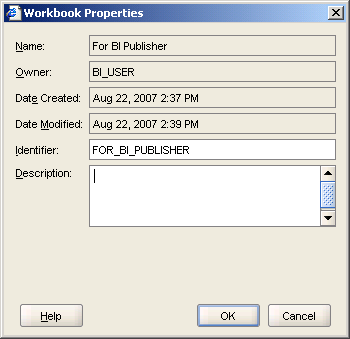
And for reasons that may become clearer in a future post (or else it can become the plot for a blockbuster whodunit - 'The Curious Case of the Gratuitous Properties Screenshot') you can see the workbook properties, including the name, the identifier, and owner.


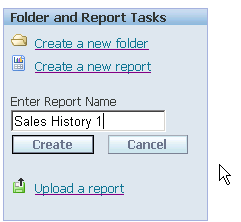
Using the steps I outlined in an earlier post, I create a BI Publisher report and point to this Discoverer worksheet as my data source. So, the first step is to create a new report as shown below, and give it a name.


If you remember, in the previous post I showed how you could use the web interface to specify that the data set for a BI Publisher report could come from a Discoverer worksheet. Well, there is more than one way to skin a cat (or is it 'bell a cat'? In any event I am a vegetarian, so these jokes are in extremely poor taste... the word 'taste' itself is a poor pun), and we shall look at a few skins bells ways here.
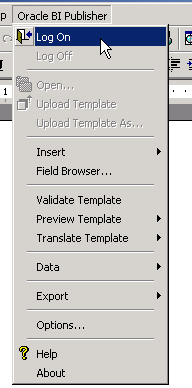
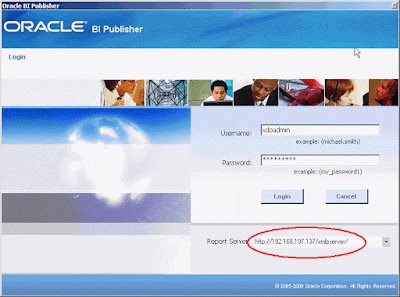
For that, let's go to Word and 
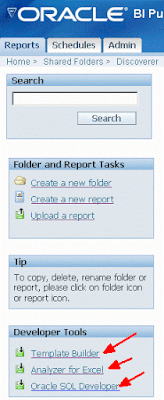
logon to BI Publisher from the 'Oracle BI Publisher' menu in Word. If you do not have the BI Publisher Template Builder for Word installed you can do that by downloading it from the BI Publisher Enterprise site.


After you have logged in the Template Builder displays a window for you to select either a template or define a new template.
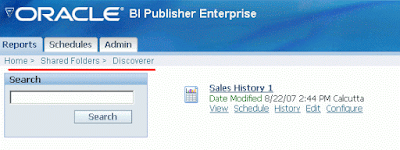
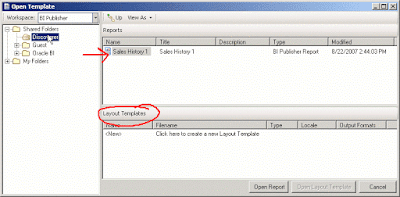
So, if you remember the report we created in BI Publisher a few minutes back, you can now browse to the report (I saved it under 'Shared Folder' : 'Discoverer'). You can see from the right hand panel that my report is there: 'Sales History 1'). But if you look down at the panel at the bottom, the one that says 'Layout Templates', it is empty. Right? Correct? Yes. That is because we do not have a layout template defined for this report. And that is what this post is all about, right? So what I could do here is double-click the 'New' text and begin creating a layout template for this report.


More Than One Way To Create a Layout
But.... let's step back a minute (please do not try this when standing near a precipice, lest you bring matters to an abrupt end) and ask ourselves: "what if I wanted to start in Template Builder to begin with, and did not actually have a report created in BI Publisher Enterprise?" theek hai (ठीक है)- that's not a problem. You can begin in Template Builder itself.
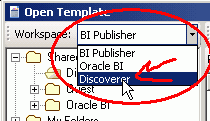
Simply click the 'Workspace' dropdown and select 'Discoverer' from the dropdown list of values. You can see that 'Oracle BI' would actually take you to an Answers repository (or BI EE), whereas selecting 'Discoverer' takes you down the BI SE path.

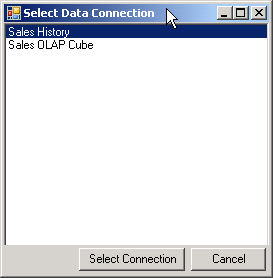
Click 'Discoverer' and out pops a dialog asking you to select a connection - you see the Sales History connection: that's what you have to select. And the 'Select Connection' dialog couldn't be any more self-explanatory.

If you are familiar with Discoverer, and I dearly hope you are - else this whole series of posts is going to go down into the big aluminum can marked as non-bio-degradable, then you will know that I still have to select a workbook and worksheet. Once you have selected the connection the list of workbooks is displayed as a hierarchical list at the left, while the panel at the right shows the worksheets available. You will notice that because the Discoverer relational folder structure is basically one level deep (you do not have sub-foldering in Discoverer relational) the expand/collapse signs are a bit redundant and clicking them doesn't really do anything. They are useful when browsing workbooks from an OLAP connection. Anyway....

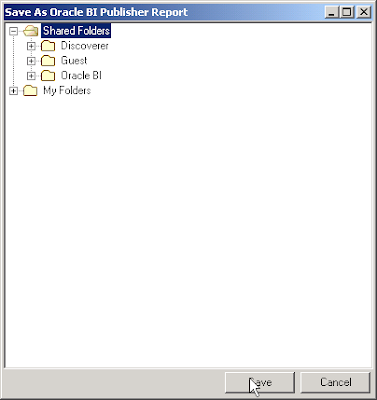
Say for this exercise I want to use the Discoverer table worksheet above, I double-click it. I now have to select a location in BI Publisher where this report should be saved under. So, another popup appears asking me to do that. In this case I choose to save it under the 'Shared Folder' folder directly (I already have one BI Publisher report based on the same Discoverer worksheet saved under the 'Discoverer' sub-folder).


Trust but verify - 
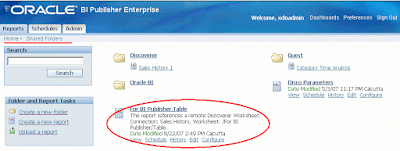
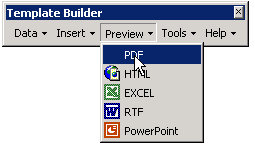
so let's make a quick detour into BI Publisher on the web and see whether the report does indeed exist where it should. Under the 'Shared Folders' folder you can see the report has been saved, and with a default name - 'For BI Publisher.Table' - which is a concatenation of the Discoverer workbook and worksheet name. And if you so desired you could click the 'Edit' link and you would see all the appropriate fields populated with values - just as if you had created the report from the web interface of BI Publisher. So you see.. that's what I meant that there is more than one way to bell the cat (CAT aspirants - sorry... but this is not what you are looking for).


Let us now return to Word and the Template Builder that is still waiting for us to return from this needless diversion and get down to the task of actually building a layout.

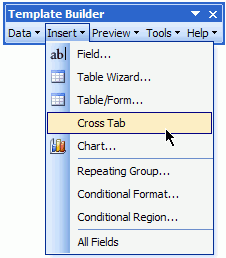
From the BI Publisher toolbar click 'Insert' and select 'Crosstab' as shown below.

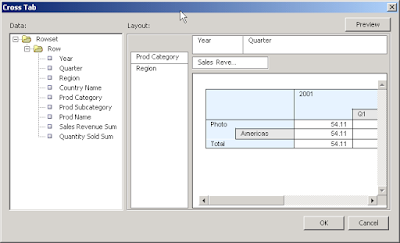
The Cross Tab layout editor is quite simple and intuitive to use. It's after all meant to let you layout your fields on the two edges (column and row) and drop a measures item onto the body of the crosstab. You can click 'Preview' to see how the crosstab shall look like, or simply click 'OK'.


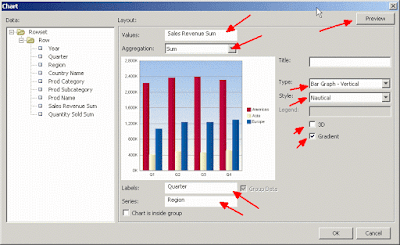
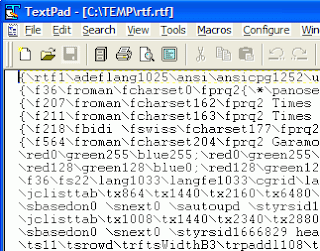
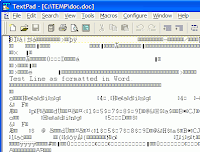
I also have added a couple of charts - the layout editor is again simple enough to use... It's probably a good idea to select a style and to uncheck the '3D' and 'Gradient' checkboxes. I don't like 3D effects or gradients in charts. Yes, yes, I am being rude in foisting my personal opinions, but regular readers of this blog would have been inured to that by now (I hope). A quick note, a sort of gotcha to be aware of. The image that gets displayed in the chart section of the editor is actually a sample image. There is one image for each combination of chart type and style and 3D effect and Gradient effect. There are more than 900 such images, one for each combination, that are available to the Template Builder.

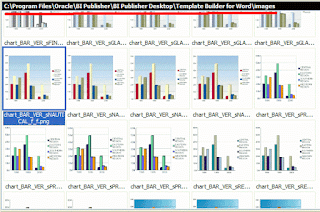
So what does it have to do here? Simply this, that if you click the 'Preview' button, the image changes to show you an actual version of the chart based on your data. Then if you change any property in the chart the image reverts back to a standard, canned image from the stock images. So don't panic - this is expected behavior, and certainly simpler than generating a new image at design time everytime you change a graph property.
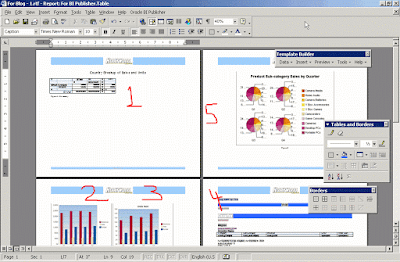

So, I now have one crosstab, two bar charts - one for Sales and one for Quantity, and I shall add one table, using the Table wizard. The wizard is, again, fairly straightforward to use.


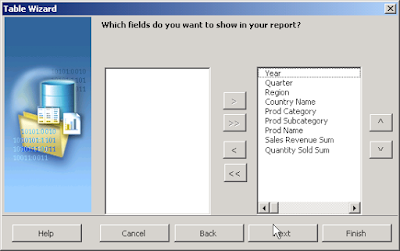
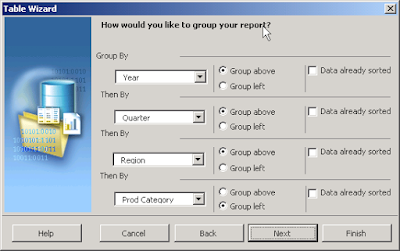
Having selected all available fields to include in my table, this next screen is important as it lets me specify how I want my fields to be grouped. Here I want a grouping by Year ('Group above') and then by Quarter.


So now I have my four views defined.


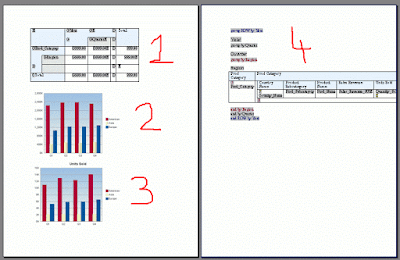
Using these layouts, I want to preview my report. At this point more than the appearance I want to make sure that my data appears ok and that the views - the crosstab, the table, the charts - are all there in the report. If I click 'Preview' and select '
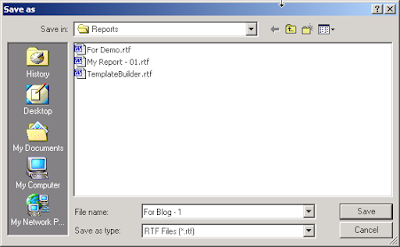
PDF' I shall be first prompted to save my report as a RTF file.

Why RTF? Because RTF is not a proprietary format like the binary DOC format that Word uses by default. As a diversion (yet another one!), take this very simple Word document with one line as shown below, and save it first as a .doc document and then as a RTF format document. Open the .RTF and .DOC files in a text editor and you shall see what I mean.


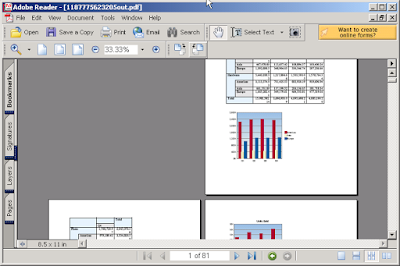
This is how my reports appears. You would notice that all the layouts are there as they should be. But not very pretty. This is because I have not started formatting them as I would like to. I am using Word, so that should be a fairly easy task to do. All I need to know is how to use the formatting capabilities of Word - headings, fonts, colors, page-breaks, table borders


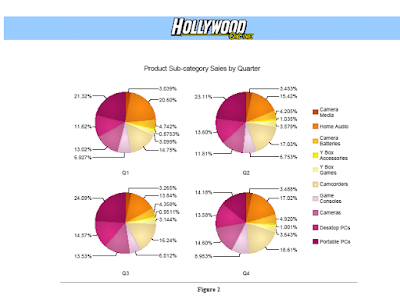
Without getting into the specifics of what and how I format I report, this below is a preview of the same report, but after I have applied lots of formatting, layout changes - and yes one change - I added a Pie graph also to the report.


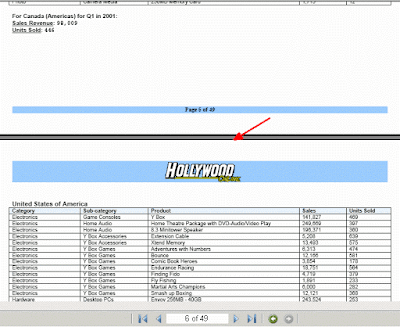
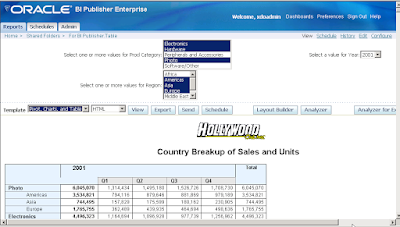
This below is the same report - what I have done is added an image to the header of the page so that it appears at the top of every page (as I have always maintained, an image is worth a thousand words, or sometimes even more)


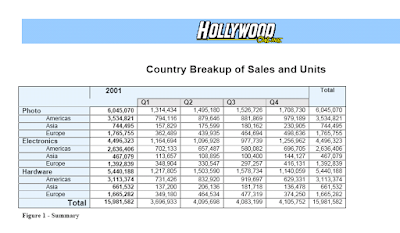
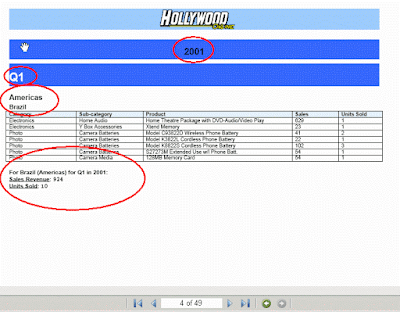
See this screenshot below - this is the table I had defined above. What I have done is applied a 'Heading 1' level style to the 'Year' and 'Quarter' items, and also a blue background. That may not be the prettiest style, but then I am not an interface designer, and like a good man I know my limitations (or maybe not).
Another thing of note that I want to point out are the totals that I have inserted at the end of each country below. That is very easily done by usnig the Template Builder option of inserting a field and then selecting the 'sum' as the aggregation method.


And in the footer of the page I have set the page numbering. And oh yes, I also have a page break after every country, so that each country's data appears on a new page - again using Word's insert page break feature (or simply enter 'Ctrl+Enter' where you want the page break - but you already knew that).


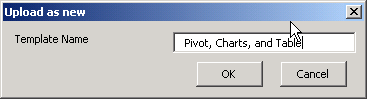
Having created on layout template, I now want to upload this to the BI Publisher Server. That can be done in two ways. You can do that straight from Word itself. Simply select 'Upload Template As...' from the Template Builder menu.


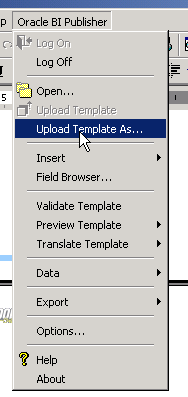
Enter a name for the layout template and click 'OK'


And voila! It's done.


You would already have guessed that using the option I could make changes to the layout template in Word and upload it as a new layout, and so on. So by making incremental changes I could very quickly create new layouts for use.

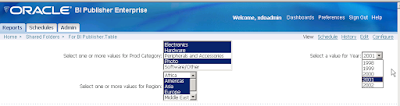
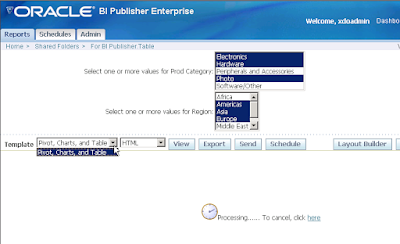
Back at BI Publisher in the browser, I now want to run the report and view it in any of the supported formats: The parameters are displayed for me to select from. And, to repeat, you can either multi-select or single-select depending on how the parameters have been setup in Discoverer.


A simple post - the next one shall look at something different in this area.

Monday, August 27, 2007

Do you have .Net 2.0?

The Oracle Business Intelligence Add-in for Microsoft Office (Excel and PowerPoint) requires the
.Net 2.0 Framework. The client installable comes prepackaged with the x86 32-bit .Net 2.0 redistributable, which adds approximately 22MB to the download size of the BI Office Add-in.

My question is: do you already have the .Net 2.0 Framework installed on your Windows PCs? Please take a few seconds to use the poll I have created to answer (the poll is also visible on the blog's home page in the sidebar).

Many thanks!

OOW 2007 News

Oracle OpenWorld 2007 (San Francisco, Nov 11-15) is just a couple of months away.

The Session Tracks | Oracle OpenWorld 2007 page lists four tracks:
and you can view a listing of all the tracks and content at this page: Oracle OpenWorld - Content Catalog

Some sessions pertinent to BI:For those interested in the Discoverer to BI EE migration, this is a session you must attend:
How-to: Migrating an Oracle Discoverer System to Oracle Business Intelligence Enterprise Edition - Mike Durran, Oracle

and two by yours truly:
In case you are interested in the new OLAP capabilities in Oracle Database 11g, especially as they relate to materialized views (MVs), this is the session for you:
Enhanced Business Intelligence and Data Warehousing with Oracle OLAP 11g - William Endress, Oracle
Early bird registrations close on September 14 (Register now)

Michael informs us at his blog that he shall be presenting a paper - Paper accepted at Open World 2007 - Build an EUL in One Hour is the official name of the session.
Mark Rittman also has a paper on BI and SOA (Open World, BIWA, UKOUG and Oracle Mag) - Integrating Oracle Business Intelligence Enterprise Edition and SOA: Step by Step is the official name of the track.

I shall, hopefully, have more posts on the conference over the next couple of months.

EUL Horror Story - From Michael's Blog

An EUL horror story - from Michael's blog. Don't read that while drinking coffee or anything hot :-)

Hilarious.

Friday, August 24, 2007

New Book : The Oracle 10gR2 Performance Tuning Tips and Techniques

At the moment I am working on a project to design a utility to help monitor performance during the execution of OLAP data loading and aggregation routines. Interestingly I received an email from Richard Niemiec at TUSC yesterday on a similar subject. As everyone knows Richard is one of the few Oracle Certified Masters and he has just published a new book on 10g performance tuning.

Amazon has just made the book available and reviews have already been posted on their site. You can checkout the book and reviews at:

http://www.amazon.com/Oracle-Database-Performance-Tuning-Techniques/dp/0072263059

The book explains how to monitor, analyze, and optimize Oracle Database 10g using the tested methods and insider advice contained in this definitive volume. The book is packed with detailed case studies, best practices, and code samples illustrating Oracle's new tuning features. Find out how to select optimal indexing options, effectively manage drives and disk arrays, troubleshoot queries, and reliably predict future performance. You'll also get detailed coverage of PL/SQL performance enhancements, initialization file tweaks, and the latest database surveying and reporting utilities.

I am going online tonight to order a copy as I know this will help with my OLAP tuning project. More on that in another post, hopefully coming soon.

Thursday, August 23, 2007

BI Office in 10.1.3.3 - Flash

Or why the BI Office in 10.1.3.3 provides the ability to insert BI Chart views inside Excel and PowerPoint as native Office charts, or as static images, or as Flash objects (only in PowerPoint).

Why Flash? No of course you shouldn't.
Isn't Flash only for movies? Isn't Flash only for animated content? Isn't Flash only for 'this' or 'that'? Aren't Flash charts supposed to jiggle, wiggle, wriggle, and do animated dances? No, I submit to you.

I would suggest you go to Wikipedia and read up this page that describes the fascinating history of Flash - the player, the platform, and format, all. Also read this page on Wikipedia - Category:Graphics file formats, lots of very useful information there.

As far as BI EE is concerned, Flash charts offer greater quality and interactivity than raster based image formats like PNG or JPEG.

BI Presentation Services however do offer you the choice of having charts render in vector based Flash or SVG formats, or as raster based PNG or JPEG images.

The way to do that is to modify the instanceconfig.xml file and specify the chart format thy heart desires. If your Oracle BI data directory is "C:\OracleBIData" then the instanceconfig.xml file can be found under the C:\OracleBIData\web\config folder.


Open the instanceconfig.xml file using a text editor and insert these three lines in the file:

<charts>
<defaultimagetype>PNG</defaultimagetype>

</charts>


Save the file.
Restart your Presentation Server. You can use Windows Services or the command line to do that (net start "Oracle BI Presentation Services")


After that go to Answers and view any chart that you had created earlier (you could even create new charts, but I thought this may be quicker), and check the properties of the chart that comes up:

Since I specified PNG as the image type, the bar chart below shows up as a PNG image in Answers.


The same bar chart as a JPEG image.


And as an SVG image.

(ठीक है ठीक है) theek hai theek hai I get it.
All this is also available in the documented Presentation Services Administration Guide (PDF): see the section "Specifying the Oracle Business Intelligence Chart Image Type" on page 50 of the doc.

So, coming back to the original question, "why Flash", the short answer is that Flash is a vector based image format and provides better quality, more interactivity (like mouse over tooltips, etc...), and charts inserted as Flash objects in presentations generally tend to look better than raster based images.

Let's elucidate with an example.

Compare these two screenshots. The one below is a bubble chart inserted as an image inside a PowerPoint presentation.

And this screenshot is of the same chart inserted in PowerPoint as a Flash chart.

As you would see the quality of the two charts is different. With the image based format there is some amount of pixelation and some blurriness in the image, but not so with the Flash chart.
But, surely, you could argue that the answer is simply to have larger sized charts in Answers in the first place. Yes, I could have a larger chart in Answers, and when I add that (larger chart) to my slide as an image the quality won't suffer. True. But that’s more work, and you may not always want to go to Answers to change your chart size- it could have unintended consequences (if you insert that chart in a Dashboard page it shall occupy an inordinately large amount of screen real estate for one). Increasing the size of the chart increases the size of the image file generated when you insert it in PowerPoint for example, but with vector based formats there is no change in file size:

See with another example:
For a pretty small chart the size of the image file is 22KB


while the Flash chart (.swf file) is 26KB (actually a little bit larger than the image file).


Now, if you increase the size of the chart, the size of the image file more than doubles to 58KB


while the Flash file increases in size by only 20% to 31KB.


And to illustrate it even better, these below are two screenshots of the same chart view.
In this case I have scaled the chart image to 200% of its original size and then taken a screenshot:


And in this case below, I have inserted the same BI chart view in a slide as a Flash object, increased the size of the object to 200% of its original size, and then take the screenshot:

Nice.
So, the next question is: why not have Flash charts in Excel too? क्यों? बोलो बोलो, कुछ तो बोलो! (
Kyon? bolo bolo, kuch to bolo!)

Well - here's the scoop. We did have Flash charts in Excel at one point during the development cycle. It's after all the same code that's calling the Presentation Server to get the Flash file for the selected chart view. And you could insert BI Chart views in Excel sheets as Flash objects. But feedback from people who tried it internally was that Flash charts in Excel are not easy to move around. Not BI Flash charts, but all Flash objects. It's almost impossible to even select them by clicking the Flash chart in Excel. Try it sometime - take a Flash chart from PowerPoint or any Flash file you can lay your hands on from anywhere else, copy it, and paste it inside an Excel sheet and then try to move it around. Also, there was the argument, philosophical in some sense, that Excel is more for displaying numbers and all, so let's leave the Flash charts for PowerPoint. Fair enough.

Let us know if you think otherwise - and if you would like Flash charts back in Excel (they never were there in the production release actually...). It’s (almost) as simple (I hope) as un-commenting back some code to enable the “Insert as Flash” back into Excel.

This is one example where we found that removing functionality can actually be a good thing and make the product better.