The clipboard (we don't really have an official name for it) lets you copy BI views from Answers or Dashboards and into Excel or PowerPoint using the BI Office Add-in as native Office charts or tables. It makes inserting BI content into Office documents simple as 1-2 (one-click to copy, one-click to paste).
The beginning:
As a sort of history into the evolution of this feature, when we first started discussing it last year, we wanted to implement something different, a sort of a Windows independent clipboard. People would be able to copy a BI object into the clipboard from Answers or Dashboards, and then a user from Excel or PowerPoint would access that network based clipboard, and insert views. Some iterations later, after discussions between the development teams – the BI Office and the Presentation Services teams – we realized that we could do it in an easier and more user-friendly way. What if we simply copied, into the Windows clipboard, the fully qualified name and path to the BI view that you copied. That would read something like "#shared/Paint Demo/Sales Summaries/Regional Analysis/Regional Revenue|ChartView1" for a chart view named 'ChartView1' in request named "Regional Revenue" that was located under the Shared : Paint Demo : Sales Summaries : Regional Analysis folder path.. Since it was in your Windows clipboard, you wouldn’t need a separate component or product to manage its contents. That worked quite well. Till we started thinking some more. (yes, insightful thought is really a binary process... it can be off for stretches of time, and then when it switches on it can cause a lot of Eureka moments, and some of them with clothes on. Note to self: STOP with these non-sequiturs.) The thought was, wouldn’t it be really, really nice if we could allow users to copy a view in any state (as in let them copy when they are in California, Nevada, Karnataka, and so on). Huh? (Abhinav - these silly and infantile witticisms were cute the first hundred times, not any more!). Let me explain. Consider a Dashboard page. Let’s take the demo Dashboard page that ships with the product.
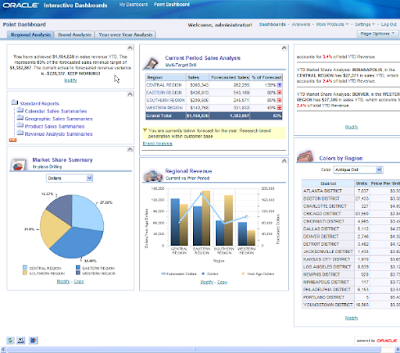
In-place drilling: Now, on this page I can do at least two different things as they relate to the BI clipboard functionality. Firstly, I can do an in-place drill into a view. Take this pie chart for example, that displays dollar sales by region:
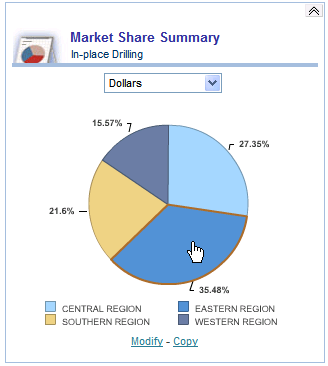
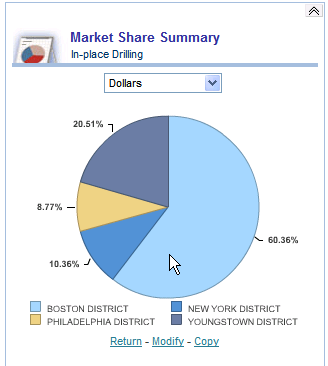
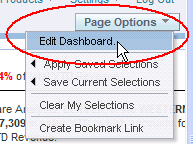
I got an in-pace drill here because that’s the way the chart has been setup in Dashboards. If you were to edit the dashboard, this is what you would see:
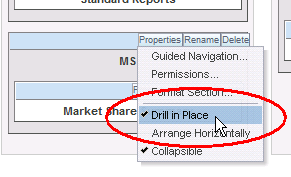
At this point, this chart has changed from its original definition.
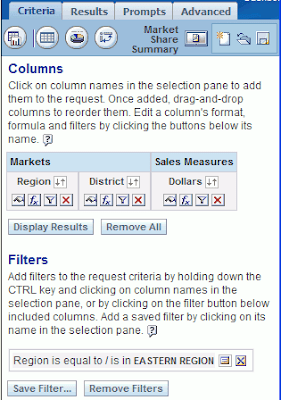
While the original chart showed me dollar sales by region (the SQL would be: SELECT Markets.Region saw_0, "Sales Measures".Dollars saw_1 FROM Paint ORDER BY saw_0), (see below)

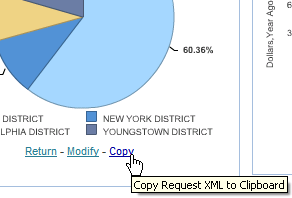
The XML
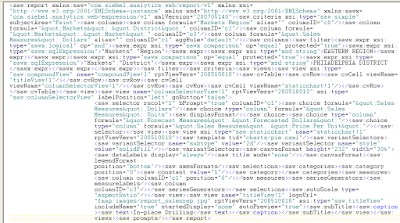

- the name of the subject area: 'Paint'
- the columns contained in the request (dollars, region, district)
- the filter (on region)
- the filter value: 'EASTERN REGION'
- all the views contained in the request - the compound view, the title view, the chart view, the column selector, etc...
- details about the chart view, including the sub-type (2D), the fill color, etc...
Ah. That’s good. I likes it.
What else can I do with the clipboard?
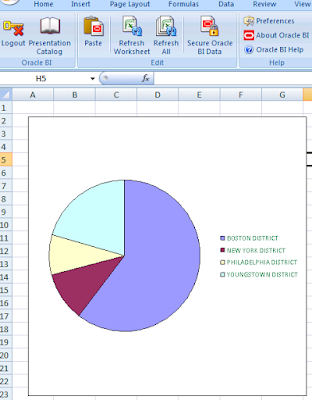
Well... let’s see. You can’t take it home to your mom. Nor can you take it out on a date. But you can go to PowerPoint and paste it there. The BI clipboard can take the same XML and turn it into beautiful Office charts in both Excel and PowerPoint. Let me correct that – it can turn XML into Office charts in both Excel and PowerPoint.
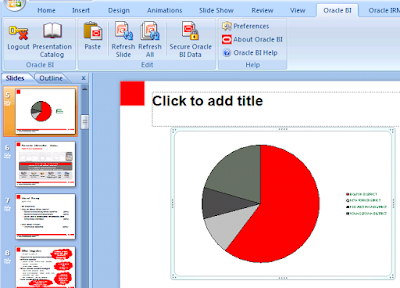
The chart above has inherited the color scheme of the PowerPoint template I am using.
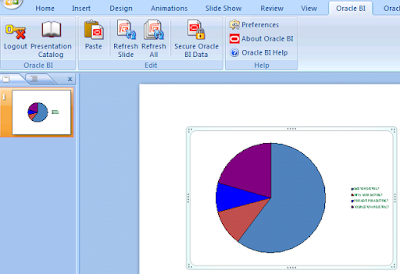
The chart above has inherted the default color scheme as this is a new PowerPoint presentation.
That’s all fine. A picture is worth a thousand words. But what if I wanted those actual thousand words? What if I wanted a table to be pasted into Excel? With many rows. Many, many rows, more than a thousand rows? Well... be my guest.
Take this longer-than-a-picture table with close to 1200 rows.


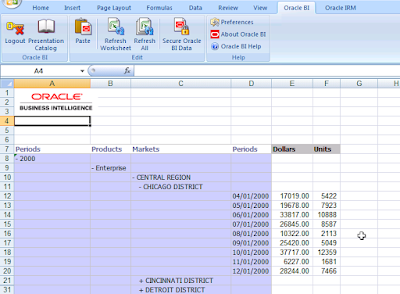
Pasting a Pivot View
Not happy with a table? Prefer a Pivot View? No problem.
Here’s the Answers Pivot View.
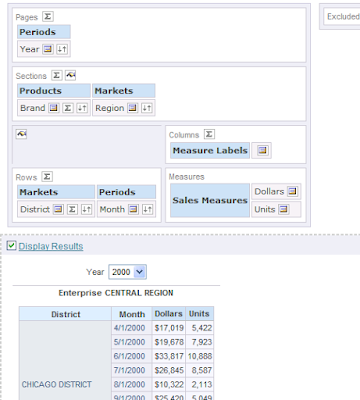
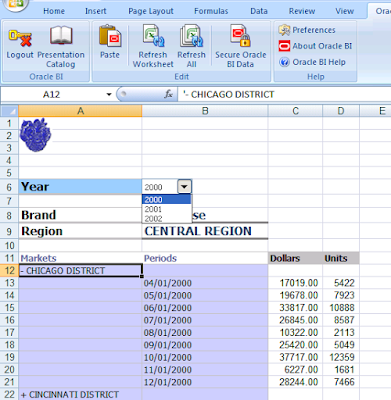
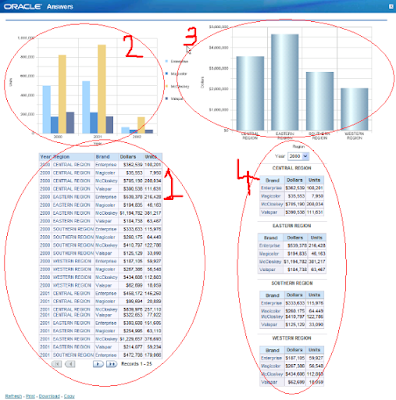
Yes. Ok. Sure.
No problem.
1 click to copy.
1 click to paste.
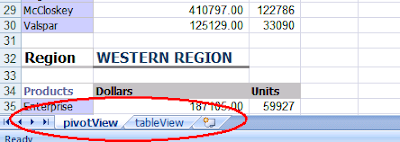
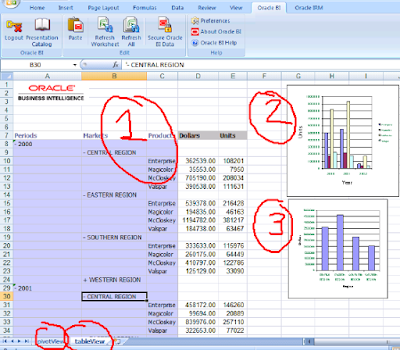
But wait! I saw something there!!! What’s this?

Ok, ok, Mahatma Gandhi. But this may get on my nerves. Seeing this message everytime I paste a BI view that contains a title view.
I agree.
So are you going to do something about it??
Yes.
What?
Go here:
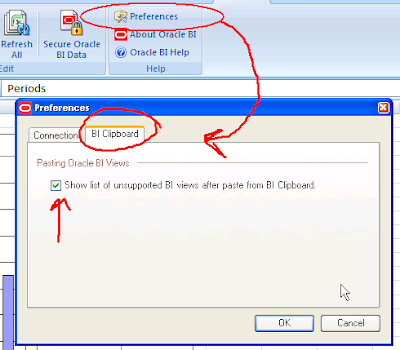
Check this box, or uncheck it to not see the message about unsupported views.
And that marks the end of the post on the BI clipboard.
IOW, Elvis has left the building.