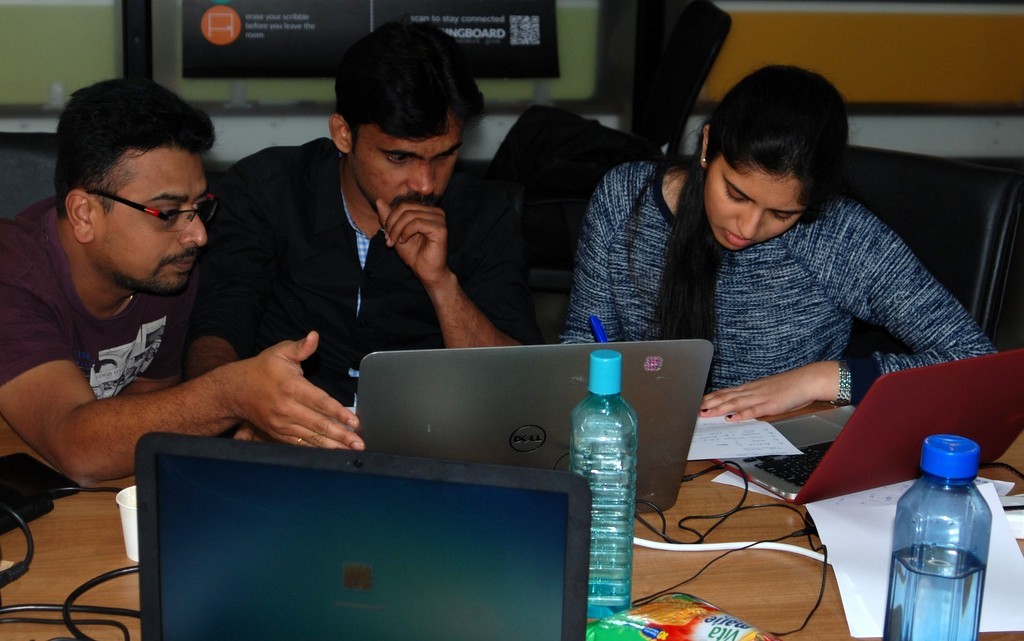
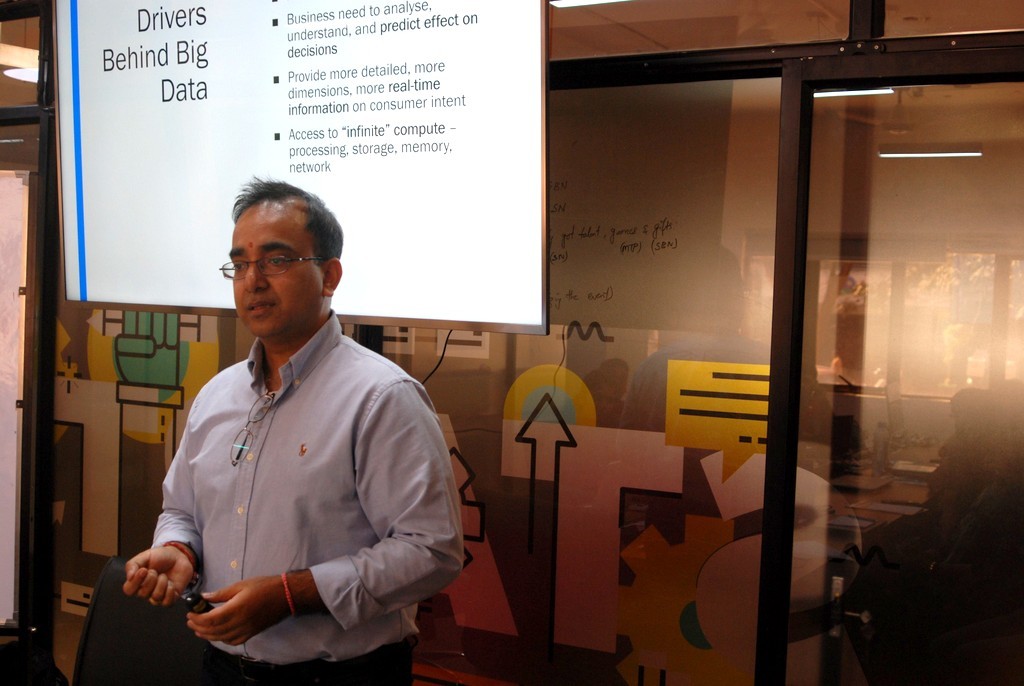
Our focus was clear - this was a level 101 class, for IT professionals in Bangalore who had heard of Big Data, were interested in Big Data, but were unsure how and where to dig their toe in the world of analytics and Big Data. A one-day workshop - with a mix of slides, white-boarding, case-study, a small game, and a mini-project - we felt, was the ideal vehicle for getting people to wrap their minds around the fundamental concepts of Big Data.

On a pleasant Saturday morning in January, Prakash Kadham and I conducted a one-day workshop, "
Introduction to Big Data & Analytics". As the name suggests, it was a breadth-oriented introduction to the world of Big Data and the landscape of technologies, tools, platforms, distributions, and business use-cases in the brave new world of big data.

We started out by talking about the need for analytics in general, the kinds of questions analytics - also known as business intelligence sometimes - is supposed answer, and how most analytics platforms used to look like at the beginning of the decade. We then moved to what changed this decade, and the growth of data volumes, the velocity of data generation, and the increasing variety of data that rendered traditional means of data ingestion and analysis inadequate.
A fun game with cards turned out to be an ideal way to introduce the participants to the concepts behind
MapReduce, the fundamental paradigm behind the processing and ingestion of massive amounts of data. After all the slides and illustrations of MapReduce, we threw in a curve-ball to the participants by telling them that some companies, like Google, had started to move away from MapReduce since it was deemed unsuitable for data volumes greater than petabyte!
The proliferation of Apache projects in almost every sphere of the Hadoop ecosystem meant that there are many, many choices for the big data engineer to choose from. Just on the subject of data ingestion, there is
Apache Flume,
Apache Sqoop,
Apache Kafka, Apache
Samza, Apache
NiFi, and many others. Or take databases, where you have columnar, noSQL, document-oriented, graph databases to choose from, each optimized for slightly different use-cases -
Hbase (the granddaddy of of noSQL databases),
Cassandra (that took birth at Facebook),
MongoDB (most suited for documents),
Neo4j (a graph database), and so on.
Working through a case-study helps bring theory closer to practice, and the participants got to work on just that - two case-studies, one in the retail segment and the other in healthcare. Coming off the slides and lectures, the participants dove into the case-studies with enthusiasm and high-decibel interactions among all the participants.
The day passed off fast enough and we ended the day with a small visualization exercise, using the popular tool,
Tableau. At the end of the long but productive day, the participants had one last task to complete - fill out a feedback form, which contained six objective questions and three free-form ones. It was hugely gratifying that all but one filled out the questionnaire. After the group photo and the workshop was formally over, Prakash and I took a look at the survey questionnaire that the participants had filled out, and did a quick, back-of-the-envelope
NPS (Net Promoter Score) calculation. We rechecked our calculations and found we had managed an NPS of 100!
The suggestions we received have been most useful, and we are now working to incorporate the suggestions in the workshop. Among the suggestions was for us to hold a more advanced, Level 200, workshop. That remains our second goal!
Thank you to all the participants who took time out to spend an entire Saturday with us, for their active and enthusiastic participation, and to the valuable feedback they shared with us! A most encouraging start to 2018!
This post was first published on LinkedIn on Feb 5, 2018.
© 2018, Abhinav Agarwal.
 According to Amazon, “Prime Music provides unlimited, ad-free access to on-demand streaming of curated playlists and stations, plus millions of songs and albums at no additional cost for eligible Amazon Prime members.”


