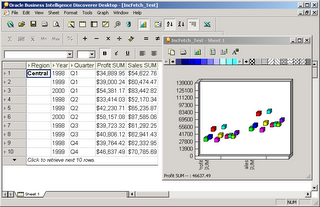
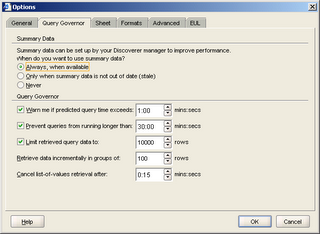
The premise is straightforward - there is an option that allows the user to specify how many rows of data should be fetched in each increment. For long tables this helps in getting the data to the user quickly. The user always has the option of using the Tools --> Retrieve All Rows option to fetch all data into the worksheet.
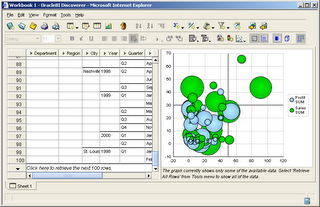
Taking an example below, I have created a table with no page items (this is important, because when you specify page-items, performance benefits of incremental data fetch are lost), and specified that data should be retrieved in increments of 100 rows. My table will return more than a thousand rows of data, so this illustrates the concept nicely.

 Notice in the screenshot below two things - only the first 100 rows of data have been fetched. There is a line at the end of the table that says "Click here to retrieve the next 100 rows.". The graph window similarly has a message that says "The graph currently shows only some of the available data. Select 'Retrieve All Rows' from Tools menu to show all of the data."
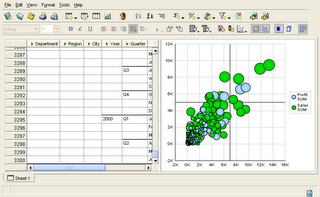
 If you click the row at the end of the table, the next 100 rows are fetched, and the graph (bubble graph) updates to now show 200 data points.
 And I can continue doing this till all rows of data are fetched into the worksheet. When no more rows of data are left to be fetched, the message no longer appears.

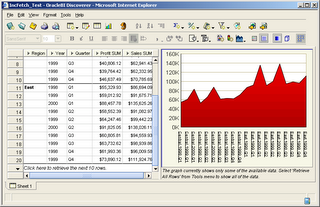
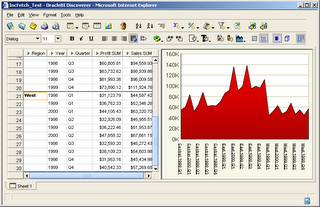
This is another example, but with a smaller dataset and a different graph type (area graph).
Discoverer Desktop had this capability in earlier versions also, but this was added to Plus in 10.1.2.
