Once the graph has been created most of the properties relating to a graph are exposed using the customizer wizards that are part of the graph toolbar in JDeveloper. Using the GUI tools you can easily create a graph something like the one shown below, where the width of the lines has been increased and the colors for each line set to match a specific theme:
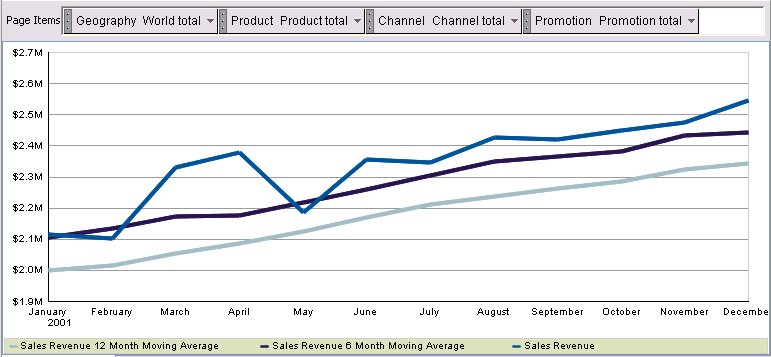
These are very basic customizations. However, the BI Beans graph does contain a lot of properties that are not covered by either the graph wizard or the customizers. There are three basic ways to access these additional properties:
1) Use the Structure and Properties panels in JDeveloper
2) Directly editing the graph XML file
3) Use the graph Java API
Method 1 : Using the Structure and Properties panels in JDeveloper
In JDeveloper the Structure and Properties panels can be used to view all the available graph properties. Once a graph is open in the JDeveloper graph editor, opening the Structure panel (Ctrl+Shift+S) will expose the all the structure of the graph bean:

Some sections contain more detailed sections and are shown as drillable in the tree. For example the plotArea has an SFX section. This controls the Special Effects features. This is not exposed in the graph Wizard or the customizers, so the Properties panel has to be invoked to both view and modify these properties. To open the Properties panel use the (Ctrl+Shift+P) key stroke. The plotArea SFX has the following properties: Using the SFX properties graph developers can add features such as background images to a graph. By setting the fillType, textureDisplay and textureURL properties it is easy to update the graph shown above by adding a background image as shown below:
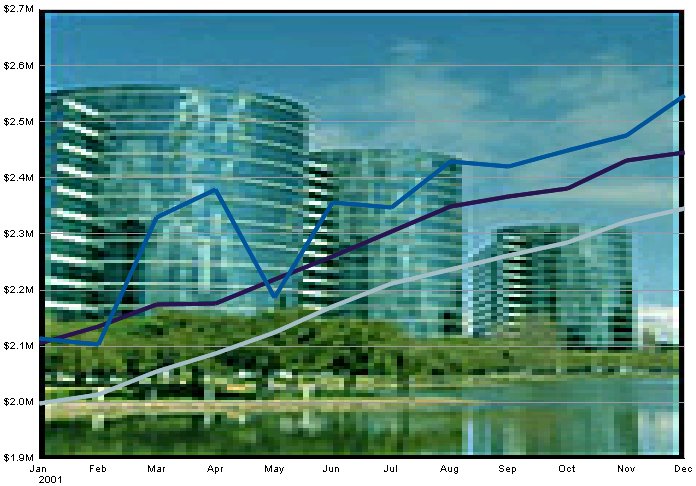 In the actual graph XML file the following additional tags are added to control the SFX features:
 By changing the textureDisplayMode to "TDM_TILED" we can create the following effect:

These effects are similar to the options available within the Windows displays properties for your Desktop, where you can use an image and have it stretched or tiled across your display.
Another feature that is only exposed via the Properties panel is the ability to wrap the text for the various title areas. In order to word-wrap long titles you simply select the required title in the structure panel, for example the Y1 Title:
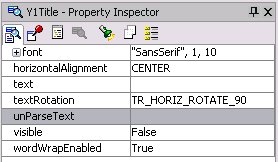
The Property panel then exposes the options such as word wrap, text rotation, alignment etc. In the graph XML file the following entry would be added:
Method 2 : Directly editing the graph XML file
If you really want to push the boundaries the next step for customizing graphs is to directly edit the graph XML. As stated above, the graph definition is saved to an XML file within the BIDesigner directory on the local file store. Developers can use any text editor to open the file and add new XML tags or edit existing tags to customize the appearance of the graph. After saving the file, in JDeveloper you only need to reload the graph to view the results of the changes to the file.
The BI Beans graph is shipped with a DTD document that lists all the available XML tags. You can see the complete list of graph attributes inside the file 'graph.dtd'. This DTD file is located in your JDEVELOPER_HOME\bibeans\lib\bipres.jar. The WinZip utility can be used to unzip the contents of this JAR file and view the dtd document. For detailed information on these attributes, refer to the technical note available on OTN from the Reports Product Management Team:
This Technical Note explains all these attributes using comments within the graph.dtd. This document will help to explain the usage of these various attributes that provide more fine-grained customization of graphs.
Directly editing the XML provides more opportunities to customize the visual representations of a graph. For example, BI Beans Graph does not provide a graph type that just plots the trend as a series of floating bars. However, by directly editing the XML it is possible to generate a graph that does have floating bars as shown below:
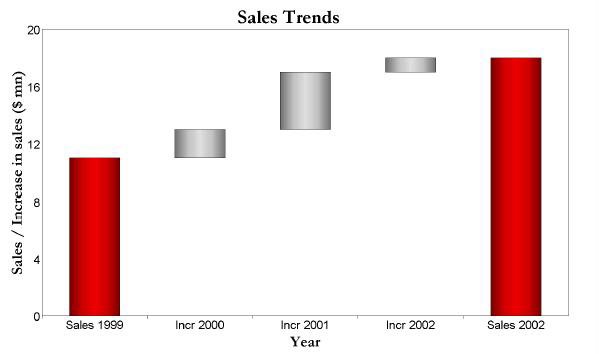
To create a graph like this is a two stage process. Assuming you have the following graph: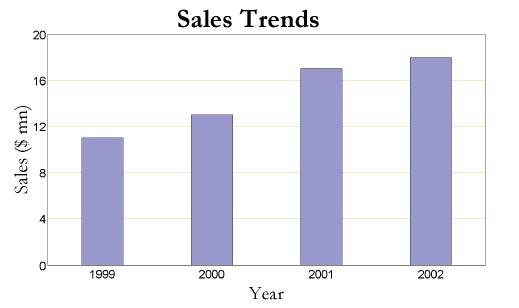
The first step is to add another series that clearly identifies the increase in sales for the years 2000-2002. Choose a stacked bar graph to show the two series. Your graph will now look like this: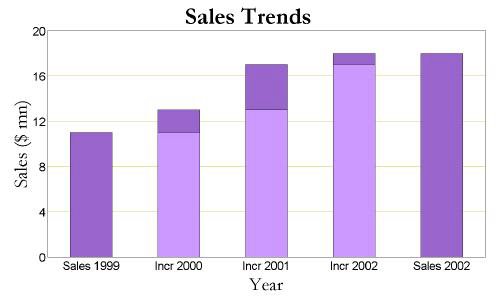
Once this has been done, the next step is to add the following to the graph xml document:
The O1 axis tick mark style is defined so that the floating bars can be identified easily with their respective labels on the X-axis. The above XML entry will make one of the series transparent, and you will get a floating effect as shown below: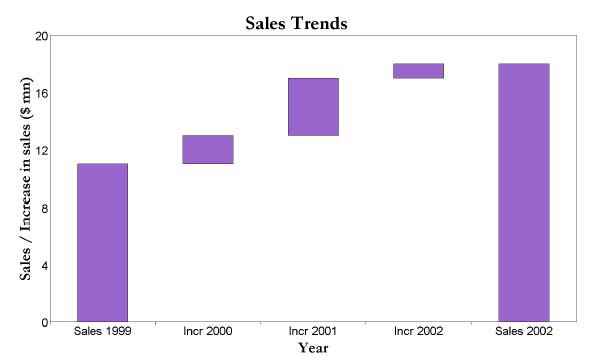
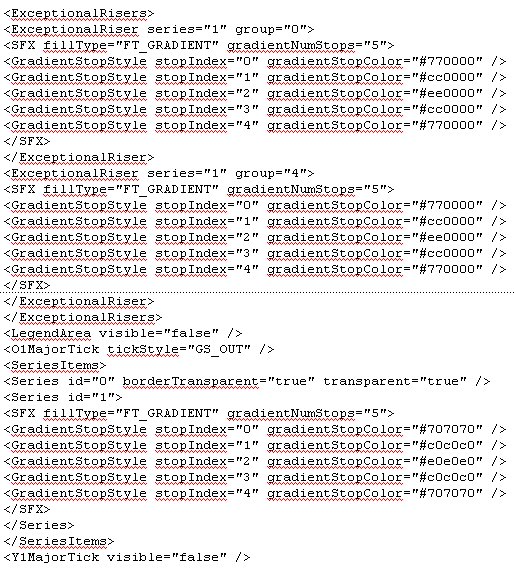
In order to show the total sales and increase in different colors, you will need to define exceptional risers. Exceptional risers are data markers that do not share series attributes, e.g., series color. Add the following to the Graph xml document to define exceptional risers: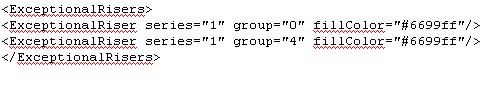
This will change the color of the total sales bars as shown below:
To make the above graph look exactly like first graph with the nice red and silver bars some additional XML statements are required to modify the color codes used as part of the series definition and apply some special effects properties as well.
Method 3 : Using the graph Java API
The last method for interacting with the Graph bean is to use the Java API. This provides access to some interesting features such as the ability to set the bars or pie slices transparent. Currently the only way to set this property is to call the graph bean API using java code as follows:
DataAccess da = graph.getModel().getDataAccess();
int seriesCount = da.getEdgeExtent(DataDirector.ROW_EDGE);
for (int i=0; i
try{
graph.getSeries().setColor(new Color(red,green,blue,alpha), i);
}
catch (SeriesOutOfRangeException se){
System.out.println(" Series out of Bound Exception ");
}
}
This method uses the constructor for Color: Color(int r, int g, int b, int a) and creates an sRGB color with the specified red, green, blue, and alpha values in the range (0 - 255). The result is as follows: 