In this day and age of "Power and Space" and being more green, data center efficiencies or inefficiencies many customers are looking at Virtualization as a means of consolidation.
One of the questions that I see on a regular basis relates to the support of Oracle BI EE and virtualization. This is slam-dunk from the perspective that Oracle is sensitive to power and space requirements as are many companies that manage their systems in their own data centers. Virtualization is addressed on two fronts by Oracle:
1) Oracle provides a virtualization solution in Oracle VM
2) The answer to the oft-asked question is – Yes!! Oracle BI EE is supported on the Oracle Virtualization solution (Oracle BI EE SRSP). This leads to another question; Is Oracle BI EE supported on VMWare? That answer is Oracle BI EE and many other Oracle products follow the statement outlined in MetaLink Note 249212.1
References:
-Oracle BI EE SRSP
-Oracle VM
-Virtualization & E-Business Suite Running Oracle Database in Solaris 10 Containers - Best Practices (MetaLink Note 317257.1). This Note is applicable for E-Business Suite Releases 11i and 12 environments.
-Support Status for VMWare (MetaLink Note 249212.1)
Saturday, March 22, 2008
Tuesday, January 08, 2008
Oracle BI makes life easier....
In many cases people often question the return on investment or the impact of using business intelligence products in real life situations. Well here is a great example of Oracle's software making life much easier for thousands of travellers, me included, passing through Manchester Airport.
As an Oracle consultant I am a frequent visitor at Manchester Airport. Over the last year travelling has not been easy due to the "one bag" rule. Although I have become quiet skilled at packing a single suitcase with clothes, laptop computer and external hard drives just so I do not have to check in my luggage. Well not any more. Manchester Airport is one of the first UK airports to return to the normal "two pieces of hand luggage" rule and its all thanks to the forecasting capabilities provided by Oracle business intelligence product suite. Our products have allowed senior management at the airport to cope with the extra pressure of screening additional bags by helping identify future trends and to plan accordingly.
The full story is on the ComputerWeekly site and can be viewed directly from here:
http://www.computerweekly.com/Articles/2008/01/07/228771/manchester-airport-lifts-one-bag-rule-with-oracle.htm
As an Oracle consultant I am a frequent visitor at Manchester Airport. Over the last year travelling has not been easy due to the "one bag" rule. Although I have become quiet skilled at packing a single suitcase with clothes, laptop computer and external hard drives just so I do not have to check in my luggage. Well not any more. Manchester Airport is one of the first UK airports to return to the normal "two pieces of hand luggage" rule and its all thanks to the forecasting capabilities provided by Oracle business intelligence product suite. Our products have allowed senior management at the airport to cope with the extra pressure of screening additional bags by helping identify future trends and to plan accordingly.
The full story is on the ComputerWeekly site and can be viewed directly from here:
http://www.computerweekly.com/Articles/2008/01/07/228771/manchester-airport-lifts-one-bag-rule-with-oracle.htm
Monday, December 17, 2007
OLAP Workshop Part 3 :Building an Analytic Workspace
OLAP Workshop Part 3 :Building an Analytic Workspace
In this lesson, we look at how to use the Analytic Workspace Manager 10g (AWM 10g) tool in conjunction with 10g OLAP to build multidimensional database objects. We will use AWM to perform the following tasks:
For this workshop we are going to focus on using AWM. For more information on using OWB to build OLAP data models see the links posted in Workshop 2.
Building Blocks of the Multi-dimensional Model

The first step is design the logical data model, including the dimensions and measures that are needed in the AW. Obviously Warehouse Builder provides the perfect environment for creating a logical data model, and there are some presentations that cover this on the OWB OTN Home.
However, if you prefer a more to use a pure data modelling tool then I would recommend looking at CWD4ALL from one of our partners, IKAN. To quote directly from their website:
CWD4ALL is a database & OLAP modeling and design tool, fully conformant to the OMG CWM™ specifications. Its advanced modeling and design capabilities provide the means to align your modeling activities with this new worldwide standard. CWD4ALL provides both forward and reverse engineering functionalities. Reverse engineering constructs a graphical model from your existing DB/2, UDB, Oracle and SQL Server 2000/2005 database or schema, which on their part can be forward engineered to an Oracle relational model and the corresponding DDL or Oracle Analytical Workspaces.
……
Multi-dimensional modelling and OLAP
The multi-dimensional model is integrated with the CWD4ALL data models, which stay on top them and use metadata from the logical model and therefore can be mapped to different implementations of relational models. Thus schema and naming independence for used tables and columns is provided, allowing a high flexibility during deployment of the model. Detailed and compact multi-dimensional diagrams provide an easy way to define dependencies in the multi-dimensional model even going beyond possibilities of traditional Star and Snowflake schemas. The multi-dimensional model provides support for OLAP & Oracle Analytical Workspaces. For relational data warehousing you will be able to deploy definitions of levels, dimensions and hierarchies to the Oracle dictionary, thus building a basis for the query rewrite option of the Oracle database. Moreover it will assist in building materialized view definition and defining bitmap join indexes. For Oracle OLAP data warehouse, CWD4ALL will deploy the multi-dimensional model to Oracle 10g Analytical Workspaces and assist in defining the SQL path to calculations in Oracle Analytical Workspaces through view definitions based on OLAP-TABLE functionality. In addition to designing and maintaining correct database relational model behavior, CWD4ALL allows the designer to examine and specify actual application behavior so that space management, undo datasets and the full range of implementation-specific parameters can be modeled and defined appropriately.
For more information on CWD4ALL click here to go to the website.
Obviously AWM can also help you design your logical data model but there is one important difference between AWM and OWB/CWD4ALL. AWM is best described as “design time at run time” which means as you create dimensions, cubes etc using AWM the object is created immediately in the analytic workspace, i.e. there is no deployment phase. Which from a business user perspective makes this an ideal product as it simplifies the whole process.
In this workshop we will create the following model based on the sales history schema (SH)
Dimensions
Stored Measures
Examining the Logical Model:
Dimensions
After you have identified dimensions, you can identify the levels of summarization within each dimension. Analysis requirements reveal that:
Cubes
Cubes provide a convenient way of collecting similar measures of the same dimensionality. It is not uncommon for many measures to have the same shape, and so by defining their shape (and other shared characteristics) for a cube, you can save time when building your AW. Multidimensional cubes are stored in AWs. A particular AW may contain more than one cube, and each cube may describe a different dimensional shape.
Dimensions defined the edges of a cube. Although there is no limit to the number of edges of a cube, BI tools typically organize the display along three edges: row edge, column edge, and page edge. A single dimension or multiple dimensions can be placed on each edge.
A cube is simply a logical object that helps an administrator to build and maintain an AW. It also aids in the definition of measures with common characteristics, such as sparsity patterns and aggregation rules. Measures in the same cube have the same relationships to other logical objects and can easily be analyzed and displayed together.
In this lesson, we will create our first cube, Sales, containing three measures. These are base measures, which store the facts collected about the business. Each measure that belongs to a particular cube shares particular characteristics with other measures in the cube, such as the same dimensions. The Sales cube includes:
Getting Started
Configuring your database:
This is an area that seems to cause the most problems. This is always surprising to me considering that OLAP 10g is completely integrated into the database engine. The key here is making sure you have the correct patches applied to your database kernel and database instance. You can validate your existing configuration against the OLAP certification matrix, which can be viewed from here:
http://www.oracle.com/technology/products/bi/olap/collateral/olap_certification.html
When applying database patches please note that the majority of patches are composed of two parts. Firstly you need to use the Universal Installer to apply the kernel updates. Secondly your database instance needs to be upgraded via a series of SQL scripts. This is all documented but many people get caught out.
In this case I am using 10.2.0.3 version of the database (Note that OLAP is available only in the Enterprise Edition of the database and is a costed option) with an additional OLAP patched described as the “OLAP A Patch” in Metalink. All this is explained in the certification matrix as stated above.
You can quickly and easily check the status of your schema by connecting to your database instance using SQLPlus (or use SQLDeveloper) and run the following commands:
col comp_name format a25 heading 'Component'
col version format a12 heading 'Version'
col status format a10 heading 'Status'
col modified heading 'Modified'
SELECT comp_name, version, status, modified
FROM dba_registry
WHERE comp_name like '%OLAP%';
Component Version Status Modified
------------------------- ------------ ---------- --------------------
OLAP Analytic Workspace 10.2.0.3.0 VALID 19-NOV-2006 08:13:33
Oracle OLAP API 10.2.0.3.0 VALID 19-NOV-2006 08:13:35
OLAP Catalog 10.2.0.3.0 VALID 19-NOV-2006 08:13:38
Setting up AWM
The first step is to download AWM from the OTN OLAP home page:
http://www.oracle.com/technology/software/htdocs/devlic.html?url=http://download.oracle.com/otn/java/olap/AWM_102030A_Win32.zip
and the associated readme file that explains installation requirements is here:
http://www.oracle.com/technology/products/bi/olap/awm102030A_readme.html
After installing AWM you can run the awm.exe file located in the ..awm/bin directory or click on the desktop icon.


Making a connection to your database instance
The first step is to create a new user to own our analytic workspace. For this example we will create a user called SH_OLAP and this user will need to have a special role assigned to it to allow the user to create and manage analytic workspaces. This role is OLAP_USER. Some people are often tempted to use a different role, OLAP_DBA. This is similar to providing a normal user with the DBA privileges. Do not be tempted to use this role as provides a lot of additional privileges that can in some cases cause lots of problems during use. This role should only be assigned to the user OLAPSYS.
CREATE USER "SH_OLAP" PROFILE "DEFAULT"
IDENTIFIED BY "SH_OLAP" DEFAULT TABLESPACE "SH_OLAP"
TEMPORARY TABLESPACE "SH_OLAP_TEMP"
ACCOUNT UNLOCK;
GRANT "CONNECT" TO "SH_OLAP";
GRANT "OLAP_USER" TO "SH_OLAP";
This user will need SELECT priviledges on the source tables that will be used to populate the dimensions and the cubes.
As a best practice I will normally assign my OLAP user to its own tablespace and create a temp tablespace specifically for that user as well. The reasons for this will become evident later when we look at what happens during the loading of data into a dimension and/or a cube. Make sure this new user has sufficient quota on both these tablespaces.
When you start AWM for the first time you will need to define a new connection to your database instance.

This step can cause problems and a number of people have posted questions on the OLAP forum regarding connecting to a database instance. Using a TNSNames alias as the connection string causes the majority of problems. You can only use a TNS alias if you also install the SQL net layer from the database client CD. This is not provided as part of the AWM installation so needs to be added as part of a separate process.
Personally I always a JDBC connection as this does require any additional software to be installed. The syntax for a jdbc connection is :
Hostname:port:sid
An example would be something like this:
klaker-uk.uk.oracle.com:1521:beans
Alternatively you can use localhost or 127.0.0.1 to identify the host:

To now connect to our database instance simply click on “+” sign next to the database name. You will notice from the picture below you can define as many connections within AWM as you need. Once the connection dialog is shown enter the username and password in the dialog box. And then click OK to start the connection process.

Creating an Analytic Workspace
To create an analytic workspace, we need to perform the following steps:
Optionally, we can choose a tablespace where this AW is stored. By default, the default tablespace is used for the schema. This is set up by the database administrator (DBA) when the schema is created. In this case the default tablespace is SH_OLAP.
Now we have created the AW, it appears in the navigator under the node where it is created. It is attached in read/write mode, which means that you can make changes to it.
At this point we have two options:

Note: Once we have created the AW, a table named AW$SH_OLAP is created at the database level. (The format for the naming convention is AW$aw_name, WHERE aw_name is the name that you have chosen for your AW.) This table stores all of the multidimensional objects in your AW.
Does Oracle OLAP Support Multiple Languages?
Yes, an AW can support multiple languages. This enables the users of your OLAP applications and tools to view the metadata and descriptive attributes in their native languages.
The number and choice of languages is restricted only by the database character set and your ability to provide translated text. To add support for multiple languages, perform the following steps:
Note: In this class, a single language is used, which is American, although the image shown below has multiple languages selected.

Creating Dimensions
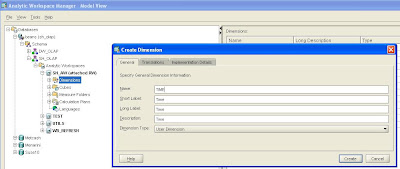
Dimensions are lists of unique values that identify and categorize data. They form the edges of measures (facts). Dimensions have structure that helps in the navigation of data and the definition of calculations. This structure includes levels, hierarchies, and attributes in the logical model. You define these supporting objects, in addition to the dimension itself, in order to have a fully functional dimension.
Dimension Type
AWM provides two types of dimensions:
Again this seems to regularly come up on the forums – you will only see the time series calculations in the Calculation Builder (See the workshop on building cubes). These calculations require two additional time based attributes to be populated – Timespan and End Date. Most customers do not have these attributes in their existing relational schemas so they need to be added. Fortunately OWB will generate an OLAP compliant time dimension. If you are not using OWB then you will need to find a different way of creating these additional attributes (there was a posting on the OLAP forum where someone actually posted all the code required to create an OLAP compliant time dimension but unfortunately I cannot find the thread now, may be someone else can locate it).
Other Tabbed Pages
The Translations tabbed page enables you to provide labels in languages that your AW uses:

The "Implementation Details" tabbed page enables you to identify certain dimension characteristics. By default I always recommend using the Surrogate Key option as this ensures unique members are created across all the levels within a dimension.

For people used to relational data models this can be quite confusing. What happens during when loading data into a dimension is all the source columns are collapsed into a single column within the AW. Therefore, across all the source columns the keys must be unique. Let’s consider an example with time:
YEAR_ID YEAR_DESC QUARTER_ID QUARTER_DESC MONTH_ID MONTH_DESC 31-12-2007 Yr 2007 31-12-2007 Q4 2007 31-12-2007 December 2007
Using this as a source table to populate our time dimension we have three keys (YEAR_ID, QUARTER_ID, MONTH_ID) that will be collapsed into a single column. It is obvious in this case the same key is used to identify three different levels within our dimension. In this case the last key that is read will win and the end result will be a single dimension member will be added to our time dimension and that member will be either a month or quarter or year (most likely a year). If we switch to using surrogate keys then three members will be added because the data load program will concatenate the level name with the source key to ensure uniqueness:
Creating Levels
For business analysis, data is typically summarized at various levels. For example, our database schema, SH, contains daily snapshots from a transactional schema (OE, HR, etc). Days are thus the base level. However, in this case the decision has been take to summarize this data up to the monthly level and then add quarterly, and yearly levels.
Levels have parent-child or one-to-many relationships, which form a hierarchy. For example, each month summarizes days, each quarter summarizes months, and each year summarizes quarters. This hierarchical structure enables analysts to detect trends at the higher levels and then drill down to the lower levels to identify factors that contributed to a trend.
To create a level for any dimension, right-click the Level icon beneath the dimension, and then select Create Level. Fill in the name, labels, and a description. The labels can be used in reports; the description enables you to comment on the object. Repeat the process for each level in the dimension.

The end result might look something like this (note I did not follow my own advice and created level names that are quite long, just to make it easier to explain certain steps in this workshop):

Creating Hierarchies
A hierarchy is a way of organizing dimension members. Oracle OLAP supports two basic types of hierarchy:
Dimensions can have one or more hierarchies. If you define multiple hierarchies, make sure to define one of them as the default hierarchy.
As shown in the image below right-clicking on the hierarchy icon in the navigator provides a pop menu option to “Create Hierarchy”.

Name the hierarchy. We can provide descriptive labels that can be used in reports. Select the “Set as Default Hierarchy” option if this is the only hierarchy for the dimension or if it is the hierarchy that will be used most frequently for analysis. In this case we can choose the Level Based Hierarchy option.
Finally we can select the levels for our hierarchy. The levels are organized from the highest level of aggregation to the lowest.

Creating Attributes
Attributes contain descriptive information about dimension members that are used for data selection and identification. They are used for labelling cross-tabular and graphical data displays, selecting data, organizing dimension members, and so on. AWM 10g defines basic attributes automatically. For each dimension, it creates long and short description attributes. For a Time dimension, it also creates time-span and end-date attributes.
We can easily add additional attributes, such as month number or quarter number. These additional attributes further enrich the AW. The Implementation Details tabbed page identifies the data type for the attribute. This data type should match the source data.
For most attributes it is useful to consider creating an Index if the attribute has a reasonably low cardinality. This will improve query performance if the attribute is used as a filter within a business query. What happens under the covers is an additional dimension is created containing the members of the attribute and a relation is created to map the attribute dimension members to the base dimension members. Oracle OLAP is very efficient at using relations during queries as a way of filtering members.

In the next sub-section of this workshop (Workshop 3), we will review how to map dimensions to source data and how to manage different types of dimensions (value based, skip level, ragged, star source table and snowflake source tables).
Don't forget the other sections of this series:
OLAP Workshop Part 1 : Basic Overview of OLAP Concepts
OLAP Workshop Part 2 : Understanding OLAP Technology
In this lesson, we look at how to use the Analytic Workspace Manager 10g (AWM 10g) tool in conjunction with 10g OLAP to build multidimensional database objects. We will use AWM to perform the following tasks:
- Create an analytic workspace
- Define dimensions
- Define cubes
- Load data from source relational tables
- View data
- Create an analytic workspace and defining dimensions
- Modelling and mapping different types of dimensions
- Define cubes and load data from source relational tables
For this workshop we are going to focus on using AWM. For more information on using OWB to build OLAP data models see the links posted in Workshop 2.
Building Blocks of the Multi-dimensional Model

The first step is design the logical data model, including the dimensions and measures that are needed in the AW. Obviously Warehouse Builder provides the perfect environment for creating a logical data model, and there are some presentations that cover this on the OWB OTN Home.
However, if you prefer a more to use a pure data modelling tool then I would recommend looking at CWD4ALL from one of our partners, IKAN. To quote directly from their website:
CWD4ALL is a database & OLAP modeling and design tool, fully conformant to the OMG CWM™ specifications. Its advanced modeling and design capabilities provide the means to align your modeling activities with this new worldwide standard. CWD4ALL provides both forward and reverse engineering functionalities. Reverse engineering constructs a graphical model from your existing DB/2, UDB, Oracle and SQL Server 2000/2005 database or schema, which on their part can be forward engineered to an Oracle relational model and the corresponding DDL or Oracle Analytical Workspaces.
……
Multi-dimensional modelling and OLAP
The multi-dimensional model is integrated with the CWD4ALL data models, which stay on top them and use metadata from the logical model and therefore can be mapped to different implementations of relational models. Thus schema and naming independence for used tables and columns is provided, allowing a high flexibility during deployment of the model. Detailed and compact multi-dimensional diagrams provide an easy way to define dependencies in the multi-dimensional model even going beyond possibilities of traditional Star and Snowflake schemas. The multi-dimensional model provides support for OLAP & Oracle Analytical Workspaces. For relational data warehousing you will be able to deploy definitions of levels, dimensions and hierarchies to the Oracle dictionary, thus building a basis for the query rewrite option of the Oracle database. Moreover it will assist in building materialized view definition and defining bitmap join indexes. For Oracle OLAP data warehouse, CWD4ALL will deploy the multi-dimensional model to Oracle 10g Analytical Workspaces and assist in defining the SQL path to calculations in Oracle Analytical Workspaces through view definitions based on OLAP-TABLE functionality. In addition to designing and maintaining correct database relational model behavior, CWD4ALL allows the designer to examine and specify actual application behavior so that space management, undo datasets and the full range of implementation-specific parameters can be modeled and defined appropriately.
For more information on CWD4ALL click here to go to the website.
Obviously AWM can also help you design your logical data model but there is one important difference between AWM and OWB/CWD4ALL. AWM is best described as “design time at run time” which means as you create dimensions, cubes etc using AWM the object is created immediately in the analytic workspace, i.e. there is no deployment phase. Which from a business user perspective makes this an ideal product as it simplifies the whole process.
In this workshop we will create the following model based on the sales history schema (SH)
Dimensions
- Time: Shows how data varies over time
- Product: Shows how data varies by product
- Geography: Shows how data varies by geography
- Channel: Shows how data varies according to each distribution channel
Stored Measures
- Sales
- Costs
- Quantity
Examining the Logical Model:
Dimensions
After you have identified dimensions, you can identify the levels of summarization within each dimension. Analysis requirements reveal that:
- Channel dimension has three levels: Total, Class, and Channel
- Geography dimension has four levels: Total, Region, Subregion, and Country
- Product dimension has four levels: Total, Category, Subcategory, and Product.
- Time dimension has three levels: Year, Quarter, and Month.
Cubes
Cubes provide a convenient way of collecting similar measures of the same dimensionality. It is not uncommon for many measures to have the same shape, and so by defining their shape (and other shared characteristics) for a cube, you can save time when building your AW. Multidimensional cubes are stored in AWs. A particular AW may contain more than one cube, and each cube may describe a different dimensional shape.
Dimensions defined the edges of a cube. Although there is no limit to the number of edges of a cube, BI tools typically organize the display along three edges: row edge, column edge, and page edge. A single dimension or multiple dimensions can be placed on each edge.
A cube is simply a logical object that helps an administrator to build and maintain an AW. It also aids in the definition of measures with common characteristics, such as sparsity patterns and aggregation rules. Measures in the same cube have the same relationships to other logical objects and can easily be analyzed and displayed together.
In this lesson, we will create our first cube, Sales, containing three measures. These are base measures, which store the facts collected about the business. Each measure that belongs to a particular cube shares particular characteristics with other measures in the cube, such as the same dimensions. The Sales cube includes:
- Dimensions: Time, Geography, Product, and Channel
- Measures: sales, costs, quantity
Getting Started
Configuring your database:
This is an area that seems to cause the most problems. This is always surprising to me considering that OLAP 10g is completely integrated into the database engine. The key here is making sure you have the correct patches applied to your database kernel and database instance. You can validate your existing configuration against the OLAP certification matrix, which can be viewed from here:
http://www.oracle.com/technology/products/bi/olap/collateral/olap_certification.html
When applying database patches please note that the majority of patches are composed of two parts. Firstly you need to use the Universal Installer to apply the kernel updates. Secondly your database instance needs to be upgraded via a series of SQL scripts. This is all documented but many people get caught out.
In this case I am using 10.2.0.3 version of the database (Note that OLAP is available only in the Enterprise Edition of the database and is a costed option) with an additional OLAP patched described as the “OLAP A Patch” in Metalink. All this is explained in the certification matrix as stated above.
You can quickly and easily check the status of your schema by connecting to your database instance using SQLPlus (or use SQLDeveloper) and run the following commands:
col comp_name format a25 heading 'Component'
col version format a12 heading 'Version'
col status format a10 heading 'Status'
col modified heading 'Modified'
SELECT comp_name, version, status, modified
FROM dba_registry
WHERE comp_name like '%OLAP%';
Component Version Status Modified
------------------------- ------------ ---------- --------------------
OLAP Analytic Workspace 10.2.0.3.0 VALID 19-NOV-2006 08:13:33
Oracle OLAP API 10.2.0.3.0 VALID 19-NOV-2006 08:13:35
OLAP Catalog 10.2.0.3.0 VALID 19-NOV-2006 08:13:38
Setting up AWM
The first step is to download AWM from the OTN OLAP home page:
http://www.oracle.com/technology/software/htdocs/devlic.html?url=http://download.oracle.com/otn/java/olap/AWM_102030A_Win32.zip
and the associated readme file that explains installation requirements is here:
http://www.oracle.com/technology/products/bi/olap/awm102030A_readme.html
After installing AWM you can run the awm.exe file located in the ..awm/bin directory or click on the desktop icon.


Making a connection to your database instance
The first step is to create a new user to own our analytic workspace. For this example we will create a user called SH_OLAP and this user will need to have a special role assigned to it to allow the user to create and manage analytic workspaces. This role is OLAP_USER. Some people are often tempted to use a different role, OLAP_DBA. This is similar to providing a normal user with the DBA privileges. Do not be tempted to use this role as provides a lot of additional privileges that can in some cases cause lots of problems during use. This role should only be assigned to the user OLAPSYS.
CREATE USER "SH_OLAP" PROFILE "DEFAULT"
IDENTIFIED BY "SH_OLAP" DEFAULT TABLESPACE "SH_OLAP"
TEMPORARY TABLESPACE "SH_OLAP_TEMP"
ACCOUNT UNLOCK;
GRANT "CONNECT" TO "SH_OLAP";
GRANT "OLAP_USER" TO "SH_OLAP";
This user will need SELECT priviledges on the source tables that will be used to populate the dimensions and the cubes.
As a best practice I will normally assign my OLAP user to its own tablespace and create a temp tablespace specifically for that user as well. The reasons for this will become evident later when we look at what happens during the loading of data into a dimension and/or a cube. Make sure this new user has sufficient quota on both these tablespaces.
When you start AWM for the first time you will need to define a new connection to your database instance.

This step can cause problems and a number of people have posted questions on the OLAP forum regarding connecting to a database instance. Using a TNSNames alias as the connection string causes the majority of problems. You can only use a TNS alias if you also install the SQL net layer from the database client CD. This is not provided as part of the AWM installation so needs to be added as part of a separate process.
Personally I always a JDBC connection as this does require any additional software to be installed. The syntax for a jdbc connection is :
Hostname:port:sid
An example would be something like this:
klaker-uk.uk.oracle.com:1521:beans
Alternatively you can use localhost or 127.0.0.1 to identify the host:

To now connect to our database instance simply click on “+” sign next to the database name. You will notice from the picture below you can define as many connections within AWM as you need. Once the connection dialog is shown enter the username and password in the dialog box. And then click OK to start the connection process.

Creating an Analytic Workspace
To create an analytic workspace, we need to perform the following steps:
- Find the schema name under which you want the AW to reside, in this case our user is SH_OLAP. Expand that schema name to display the Analytic Workspaces node.
- Next right-click the “Analytic Workspaces” node. This will show the “Create New Analytic Workspace” dialog box appears.
- Lastly we can enter a name for our AW which in this case is SH_AW.
Optionally, we can choose a tablespace where this AW is stored. By default, the default tablespace is used for the schema. This is set up by the database administrator (DBA) when the schema is created. In this case the default tablespace is SH_OLAP.
Now we have created the AW, it appears in the navigator under the node where it is created. It is attached in read/write mode, which means that you can make changes to it.
At this point we have two options:
- Manually define our dimensions and cubes
- Load a predefined model from a template

Note: Once we have created the AW, a table named AW$SH_OLAP is created at the database level. (The format for the naming convention is AW$aw_name, WHERE aw_name is the name that you have chosen for your AW.) This table stores all of the multidimensional objects in your AW.
Does Oracle OLAP Support Multiple Languages?
Yes, an AW can support multiple languages. This enables the users of your OLAP applications and tools to view the metadata and descriptive attributes in their native languages.
The number and choice of languages is restricted only by the database character set and your ability to provide translated text. To add support for multiple languages, perform the following steps:
- In the Model View navigation tree, expand the folder for the AW.
- Click the Languages folder, and select the languages for the AW on
- the General tabbed page.
- As you create your objects, such as dimensions, levels, hierarchies, attributes, cubes, measures, calculated measures, and measure folders, open the Translations tabbed page of the property sheet. Enter the object labels and descriptions in each language.
Note: In this class, a single language is used, which is American, although the image shown below has multiple languages selected.

Creating Dimensions
Dimensions are lists of unique values that identify and categorize data. They form the edges of measures (facts). Dimensions have structure that helps in the navigation of data and the definition of calculations. This structure includes levels, hierarchies, and attributes in the logical model. You define these supporting objects, in addition to the dimension itself, in order to have a fully functional dimension.
Dimension Type
AWM provides two types of dimensions:
- User Dimensions
- Time Dimensions
Again this seems to regularly come up on the forums – you will only see the time series calculations in the Calculation Builder (See the workshop on building cubes). These calculations require two additional time based attributes to be populated – Timespan and End Date. Most customers do not have these attributes in their existing relational schemas so they need to be added. Fortunately OWB will generate an OLAP compliant time dimension. If you are not using OWB then you will need to find a different way of creating these additional attributes (there was a posting on the OLAP forum where someone actually posted all the code required to create an OLAP compliant time dimension but unfortunately I cannot find the thread now, may be someone else can locate it).

Other Tabbed Pages
The Translations tabbed page enables you to provide labels in languages that your AW uses:

The "Implementation Details" tabbed page enables you to identify certain dimension characteristics. By default I always recommend using the Surrogate Key option as this ensures unique members are created across all the levels within a dimension.

For people used to relational data models this can be quite confusing. What happens during when loading data into a dimension is all the source columns are collapsed into a single column within the AW. Therefore, across all the source columns the keys must be unique. Let’s consider an example with time:
YEAR_ID YEAR_DESC QUARTER_ID QUARTER_DESC MONTH_ID MONTH_DESC 31-12-2007 Yr 2007 31-12-2007 Q4 2007 31-12-2007 December 2007
Using this as a source table to populate our time dimension we have three keys (YEAR_ID, QUARTER_ID, MONTH_ID) that will be collapsed into a single column. It is obvious in this case the same key is used to identify three different levels within our dimension. In this case the last key that is read will win and the end result will be a single dimension member will be added to our time dimension and that member will be either a month or quarter or year (most likely a year). If we switch to using surrogate keys then three members will be added because the data load program will concatenate the level name with the source key to ensure uniqueness:
- YEAR_31-12-2007
- QUARTER_31-12-2007
- MONTH_31-12-12007
Creating Levels
For business analysis, data is typically summarized at various levels. For example, our database schema, SH, contains daily snapshots from a transactional schema (OE, HR, etc). Days are thus the base level. However, in this case the decision has been take to summarize this data up to the monthly level and then add quarterly, and yearly levels.
Levels have parent-child or one-to-many relationships, which form a hierarchy. For example, each month summarizes days, each quarter summarizes months, and each year summarizes quarters. This hierarchical structure enables analysts to detect trends at the higher levels and then drill down to the lower levels to identify factors that contributed to a trend.
To create a level for any dimension, right-click the Level icon beneath the dimension, and then select Create Level. Fill in the name, labels, and a description. The labels can be used in reports; the description enables you to comment on the object. Repeat the process for each level in the dimension.

The end result might look something like this (note I did not follow my own advice and created level names that are quite long, just to make it easier to explain certain steps in this workshop):

Creating Hierarchies
A hierarchy is a way of organizing dimension members. Oracle OLAP supports two basic types of hierarchy:
- Value based
- Level Based
Dimensions can have one or more hierarchies. If you define multiple hierarchies, make sure to define one of them as the default hierarchy.
As shown in the image below right-clicking on the hierarchy icon in the navigator provides a pop menu option to “Create Hierarchy”.

Name the hierarchy. We can provide descriptive labels that can be used in reports. Select the “Set as Default Hierarchy” option if this is the only hierarchy for the dimension or if it is the hierarchy that will be used most frequently for analysis. In this case we can choose the Level Based Hierarchy option.
Finally we can select the levels for our hierarchy. The levels are organized from the highest level of aggregation to the lowest.

Creating Attributes
Attributes contain descriptive information about dimension members that are used for data selection and identification. They are used for labelling cross-tabular and graphical data displays, selecting data, organizing dimension members, and so on. AWM 10g defines basic attributes automatically. For each dimension, it creates long and short description attributes. For a Time dimension, it also creates time-span and end-date attributes.
We can easily add additional attributes, such as month number or quarter number. These additional attributes further enrich the AW. The Implementation Details tabbed page identifies the data type for the attribute. This data type should match the source data.
For most attributes it is useful to consider creating an Index if the attribute has a reasonably low cardinality. This will improve query performance if the attribute is used as a filter within a business query. What happens under the covers is an additional dimension is created containing the members of the attribute and a relation is created to map the attribute dimension members to the base dimension members. Oracle OLAP is very efficient at using relations during queries as a way of filtering members.

In the next sub-section of this workshop (Workshop 3), we will review how to map dimensions to source data and how to manage different types of dimensions (value based, skip level, ragged, star source table and snowflake source tables).
Don't forget the other sections of this series:
OLAP Workshop Part 1 : Basic Overview of OLAP Concepts
OLAP Workshop Part 2 : Understanding OLAP Technology
Friday, November 30, 2007
OLAP Workshop Part 2 : Understanding OLAP Technology
OLAP Workshop Part 2 : Understanding OLAP Technology
In the last posting I hopefully explained some of the basic concepts behind OLAP. In this posting I want to explore how those basic concepts are exposed by the various OLAP aware ETL and reporting tools provided by Oracle and other BI vendors.
Architecture of Oracle OLAP

For a long time now Oracle has been unique in the marketplace. With Oracle Database 9i, 10g and 11g, all data (relational and multidimensional) is stored in one Oracle database. Only Oracle OLAP provides native multidimensional data types within the database.
A high-level architectural view of the Oracle OLAP option contains three parts:
Oracle Database 10g OLAP option, which comprises:
- Multidimensional data types
- OLAP calculation engine
- Open-access interfaces
Administrative tools used to create and manage multidimensional data types. Oracle provides two administrative tools that can be used to create multidimensional data types in Oracle Database 10g:
- Oracle Warehouse Builder
- Analytic Workspace Manager
Components of Oracle OLAP
With the Oracle OLAP option, you get two powerful arenas of functionality:
- OLAP API and the analytic workspace (AW).
- OLAP API Functionality

Analytic Workspace The Analytic Workspace is the container for the multidimensional data types and leverages the multidimensional calculation engine of the OLAP Option. The AW also provides a standard SQL interface to the multi-dimensional model. This provides an industry standard access layer that can be used by any BI reporting tool that generates SQL commands, from SQL Developer, to Application Express on to more sophisticated tools such as BI EE.
The AW also povides an XML API for administration, and a programming language (OLAP DML).
Multidimensional Data Store The OLAP option provides true array-based multidimensional data types within the Oracle database. These multidimensional data types are contained in special tables in Oracle called analytic workspaces. Some data types are used to store data, whereas others are calculated instantaneously using the multidimensional engine.
Multidimensional Calculation Engine The OLAP Option’s multidimensional engine includes an impressive library of multidimensional-aware calculation functions and support for planning functionalities such as statistical forecasts, models, allocations, projections, and “what-if”scenarios, in the context of Analytic Workspaces. The multidimensional engine interacts with the multidimensional data types in the analytic workspace in the Oracle database.
The Oracle OLAP option provides a specialized Java API that developers can use to exploit the full power of the Oracle OLAP option by using advanced dimensionally-aware tools and applications. This API is used by Oracle Business Intelligence tools such as OracleBI Beans, OracleBI Discoverer, OracleBI Spreadsheet Add-In, and Oracle Reports OLAP Plug-in to provide a true multi-dimensional query and calculation environment.
OLAP DML The OLAP DML is an extremely powerful and analytically rich feature of the AW. It is a dimensionally-aware, high-level procedural language that runs in the database and exploits the multidimensional engine and multidimensional data types.
With the Oracle OLAP option developers can exploit the OLAP DML to add more sophisticated calculations and analysis to AWs and to extend the functionality of applications that access them. The OLAP DML is briefly introduced in the lesson titled “Previewing Advanced Oracle OLAP Features.”
AW API The AW API is a Java API that is used to define and physically build multidimensional analytic workspaces inside Oracle Database 10g. The AW API is used by administrative tools such as Analytic Workspace Manager and may be used by developers, if required, to enhance and extend analytic workspaces as necessary for a specific application.
Query Access to Oracle OLAP
Different users with different end-user tool requirements can all access the same data, taking advantage of the same calculations, and benefit from the same security, scalability, performance, and availability of the Oracle database.

OLAP API The OLAP API is designed to work with both multidimensional data types and relational data types in the Oracle database.
- The API enables you to directly access multidimensional data types in the AW.
- To access relational data types, you can register a relational physical dimensional model (such as a star or snowflake schema) to the Oracle Database OLAP Catalog.
Therefore, tools that use the OLAP API can be deployed against multidimensional analytic workspaces or suitable relational schemas that are registered to the Oracle OLAP option’s metadata layer.
Many Oracle source business intelligence tools take full advantage of the multidimensional query data model provided by the Oracle OLAP option through the OLAP API. These include OracleBI Spreadsheet Add-In, OracleBI Discoverer, OracleBI Beans, and OracleBI Reports.
SQL Interface
Unlike other multidimensional OLAP server products, Oracle OLAP provides not only a specialized API but also industry-standard SQL to access multidimensional data types.
You can use a simple SQL query with relationally oriented tools and applications to gain access to the multidimensional data types in the Oracle database. As a result, your SQL-based applications (such as report generators and ad hoc query tools) can access multidimensional data and calculations managed by the Oracle OLAP option.
SQL and PL/SQL are also used to manage and maintain multidimensional analytic workspaces and to move data between relational and multidimensional data types within the Oracle database.
For example, Oracle Application Express is an easy-to-use tool that is supplied with Oracle Database 10g for Web access to the Oracle database. Oracle Application Express is an example of a SQL-based application with no built-in OLAP knowledge that can nevertheless leverage the power of Oracle OLAP.
Many third-party tools from independent software vendors and Oracle partners, such as Arcplan, Business Objects, Cognos, and a large and growing number of business intelligence vendors throughout the world, access OLAP data through the Oracle OLAP option. Some of these vendors’ tools leverage the OLAP API, whereas others exploit the SQL query interface.
Dimensionally Aware Products
Oracle BI Spreadsheet Addin OracleBI Spreadsheet Add-In makes it easy to access OLAP data through the familiar spreadsheet environment of Microsoft Excel. After installation of OracleBI Spreadsheet Add-In, “OracleBI” appears as a new menu item in Excel. By using OracleBI Spreadsheet Add-In, you can establish a secure connection to the OLAP data source and use Excel as the front-end access tool to the data in the database.
Here are some of the features of OracleBI Spreadsheet Add-In:
- It combines the flexibility and familiarity of Excel and the power, scalability, and security of the Oracle OLAP option.
- OracleBI Query and Calculation Builders: After the connection is established, you can use the wizard-driven interface to drill, pivot, page through large cubes, and create reports.
- Access to native Excel features
- Powerful data-formatting features of Excel,
- Combine Oracle OLAP data with other Excel data
- Write Excel macros that leverage all your data.
- Create formulas and graphs in Excel

When using Excel OLAP calculations are performed directly in the database: The benefit of using OracleBI Spreadsheet Add-In is that you no longer need to download massive amounts of data to your spreadsheet. Oracle Database 10g OLAP performs all the OLAP calculations quickly and efficiently in the database. The calculations and business logic are defined only once in the database and then shared across the user community.
For more information goto the Spreadsheet Addin home page on OTN:
Spreadsheet Addin OTN Home Page
http://www.oracle.com/technology/products/bi/spreadsheet_addin/index.html
OracleBI Spreadsheet Add-In Feature Overview
http://www.oracle.com/technology/products/bi/spreadsheet_addin/htdocs/feature_overview/oraclebi_spreadsheet_addin_fov.htm
Introduction to OracleBI Spreadsheet Add-In
http://www.oracle.com/technology/products/bi/spreadsheet_addin/viewlets/olapsa_welcome_viewlet_swf.html
OracleBI Discoverer
This is another Oracle Business Intelligence tool that can directly access Oracle OLAP data. Discoverer Plus OLAP is an ad hoc query, reporting, analysis, and Web-publishing tool. It enables you to:
- Perform OLAP query, reporting, and analysis on both multidimensional data models (analytic workspaces) and relational OLAP data models (star or snowflake schemas).
- Access and analyze multidimensional data from your company’s database without having to understand complex database concepts. The wizards and menus of Discoverer Plus OLAP guide you through the steps to retrieve and analyze multidimensional data.

For more information goto the Discoverer home page on OTN:
Discoverer OTN Home Page
http://www.oracle.com/technology/products/discoverer/index.html
Creating OLAP worksheets
http://www.oracle.com/technology/products/discoverer/files/viewlets/1012_plus_olap_creating.html
Modifying OLAP worksheet properties
http://www.oracle.com/technology/products/discoverer/files/viewlets/1012_Plus_OLAP_Modifying.html
OracleBI Beans
OracleBI Beans is used by business intelligence and OLAP developers. OracleBI Beans is used for developing applications such as Oracle Enterprise Planning and Budgeting and tools such as OracleBI Discoverer and OracleBI Spreadsheet Add-In. BI Beans is also available to third-party software developers to accelerate development of custom OLAP applications.

BI Beans is a set of standards-based Java beans that is integrated into Oracle JDeveloper. It provides analysis-aware application building blocks designed for the Oracle OLAP option of the Oracle database. Using BI Beans, you can create customized business intelligence applications that take advantage of the robust analytic capabilities of Oracle OLAP.
Applications can include advanced features such as interactive user interfaces, drill-to-detail reports, forecasting, and what-if analysis. BI Beans includes Java beans for acquiring data from the Oracle database, presenting data in a variety of crosstab and graph formats, and saving report definitions, custom measures, and data selections.
Using BI Beans, you can develop business intelligence applications from Oracle JDeveloper, or any Java application development environment, and deploy them through any application server as a thin or thick client.
For more information goto the BI Beans home page on OTN:
BI Beans OTN Home Page
http://www.oracle.com/technology/products/bib/index.html
Oracle BI Beans Feature Overview
http://www.oracle.com/technology/products/bib/1012/htdocs/feature_overview/BI_Beans_Feat_Oview.htm
Developing a Dashboard Application with Oracle BI Beans
http://www.oracle.com/technology/products/bib/1012/viewlets/MS Developing Executive Insight.html
SQL Aware Products
Oracle Business Intelligence EE
Oracle Business Intelligence Suite Enterprise Edition 10g, Release 3 (BI EE 10g ) delivers significant new product enhancements to further enable enterprise-wide BI, including integration with Oracle OLAP. In this release, Oracle's native multidimensional data model -- the analytic workspace (AW) -- is made accessible to BI EE 10g by creating the required metadata in Oracle BI Administration Tool. The AW data is exposed to the BI EE 10g product stack, and the OLAP engine is leveraged for analysis of that data.
Creating access to Oracle OLAP data is a simple 3-step process. Each these steps is covered in detail as part of an training document provided as an Oracle by Example. This explains how to: prepare an AW for access by BI EE 10g; create the required metadata using Oracle BI Administration Tool; and create analytic reports of AW data using Oracle BI Answers

For more information goto the BI EE home page on OTN:
BI EE OTN Home Page
http://www.oracle.com/technology/products/bi/enterprise-edition.html
Ad-hoc query and reporting
http://www.oracle.com/technology/products/bi/enterprise-edition-platform-components.html
Oracle By Example:
These lessons are designed for completion in the order that is shown below. Each subsequent lesson depends on the completion of the previous lesson. Click on any of the links below to begin.
Lesson 1: Preparing an Analytic Workspace for Access by Oracle BI EE 10g
http://www.oracle.com/technology/obe/obe_bi/bi_ee_1013/olap/PrepareAW.htm
Lesson 2: Creating BI EE 10g Metadata for the Analytic Workspace
http://www.oracle.com/technology/obe/obe_bi/bi_ee_1013/olap/CreateMetadata.htm
Lesson 3: Querying OLAP Data Using Oracle BI Answers
http://www.oracle.com/technology/obe/obe_bi/bi_ee_1013/olap/QueryData.htm
Oracle Application Express
The Oracle OLAP option provides a SQL interface to access multidimensional data types, thus enabling any SQL-aware tool to access data in the analytic workspace.
Oracle Application Express is an easy-to-use report builder that is provided with Oracle Database 10g to simplify the creation of database-centric interactive Web pages.
Thus, with the Oracle OLAP option, you can use Oracle Application Express to provide Web-based access to key performance indicators such as profitability, sales, units shipped, trends, and period-to-period comparisons and forecasts.
It provides support for some interactive reporting (for example, you can use hypertext links to call more SQL queries), but it is not a fully interactive analysis system like OracleBI Discoverer or like other specialized business intelligence tools.

The Web report in the slide is generated with the following SQL code:
SELECT region_desc, sales, units, cost, profit,
ROUND(pct_margin ,3), fcast_sales
FROM mysalesaw_view
WHERE time_desc = TO_CHAR(ADD_MONTHS(SYSDATE,-3), 'Mon-YY')
AND product_level = ‘ALL'
AND channel_level = ‘ALL'
AND customer_level= 'REGION'
ORDER BY sales DESC;
Because the multidimensional data model presents data to the query layer as if it were precalculated, prejoined, and preaggregated, your query does not need to perform any calculations, joins, or aggregations. SQL code is thus very simple to write and fully leverages the power of the AW. The multidimensional engine returns the requested data from the AW extremely efficiently and quickly, even if the AW is calculating much of the data instantaneously.
For more information goto the Application Express home page on OTN:
Application Express OTN Home Page
http://www.oracle.com/technology/products/database/application_express/index.html
What is Oracle APEX?
http://www.oracle.com/technology/products/database/application_express/html/what_is_apex.html
3.0 New Features
http://www.oracle.com/technology/products/database/application_express/html/3.0_new_features.html
Tools to Build an Analytic Workspace
Two tools are available for IT and power users to easily build analytic workspaces (AWs) and load them with data (for analysis with tools such as OracleBI Beans, OracleBI Discoverer, and OracleBI Spreadsheet Add-In):

Shared API for AW Creation Both OWB and AWM use the AW XML API to build and maintain AWs. Therefore, an AW model that is created by AWM can be incorporated back into the OWB repository to provide version control, lineage, and impact analysis if changes to the original source systems are required.
Note: Both OWB and AWM generate scripts that may be called and scheduled from PL/SQL scripts or other scheduling processing tools, if required.
Analytic Workspace Manager (AWM) AWM is a tool that makes it easy to build and maintain AWs from a suitable (clean) data source. AWM is used on source data that has been cleaned by the ETL process.
The clean data may have been created by Oracle Warehouse Builder or by another ETL process; your IT department would have a preferred method of preparing data.
AWM is focused on the simple task of building AWs. It has an intuitive wizard-based user interface and is therefore suitable for both IT and power users.
AWM supports the complete process of creating an AW from beginning to end in a single, dimensionally-aware design environment.
The creation process includes three easy steps:
- Design the dimensional model.
- Map the dimensional object to the source data.
- Load the data into the AW.
For more information goto the OLAP home page on OTN:
OLAP OTN Home Page
http://www.oracle.com/technology/products/bi/olap/olap.html
Analytic Workspace Manager 10.2.0.3.0A
http://www.oracle.com/technology/software/htdocs/devlic.html?url=http://download.oracle.com/otn/java/olap/AWM_102030A_Win32.zip
Analytic Workspace Manager 10g
http://www.oracle.com/technology/products/bi/olap/1451_AWM10g.pdf
Improve SQL Based Business Intelligence Tools with Oracle OLAP 11g
http://www.oracle.com/technology/products/bi/olap/Oracle_OLAP_11g_TWP.pdf
Leveraging Business Intelligence Tools
http://www.oracle.com/technology/products/bi/olap/40261_leveragingtools.pdf
Analytic Workspace Manager 10.2.0.3.0
http://www.oracle.com/technology/products/bi/olap/viewlet/AWM102_viewlet_swf.html
OracleBI Warehouse Builder 10g R2 (OWB) OWB is an advanced management and ETL tool, used by developers and database administrators to build and manage data warehouses in the Oracle database. OWB manages the entire process of collecting and cleaning data.
- Collecting data: OWB collects data from the various operational systems that feed the data warehouse.
- Cleaning data: OWB performs various required transformations and data-cleansing activities (for example, dealing with inconsistencies between different source systems, matching and merging data from them, and processing missing or erroneous data).
The result is a set of clean tables in the Oracle database.
- OWB includes advanced data-profiling features.
- OWB enables data warehouse developers to optionally populate relational star or snowflake schemas or multidimensional AWs for access by the Oracle OLAP option.
- OWB is, therefore, a professional IT tool.
Warehouse Builder is free to database customers and this free functionality includes deploying OLAP schemas. Some Warehouse Builder features are costed options and these include:
- Enterprise ETL
- Data Quality
- CRM/ERP Connectors
OTN Home Page
http://www.oracle.com/technology/products/warehouse/index.html
Oracle Warehouse Builder 10gR2 and Oracle OLAP
http://www.oracle.com/technology/products/warehouse/pdf/OWB10gR2 and Oracle OLAP.pdf
Benefits of a Multi-dimensional Model
http://www.oracle.com/technology/products/warehouse/pdf/Benefits of a multi-dimensional model.pdf
Summary
In this latest post you should have learned how to describe:
- Oracle OLAP and its components
- The flexibility of (and options for) accessing Oracle OLAP data
- Oracle business intelligence tools and applications that access the analytic workspace in the Oracle database
- Oracle administrative tools that enable building and maintenance of analytic workspaces
Wednesday, November 21, 2007
OLAP Workshop : Basic Overview of OLAP Concepts
I have recently been working with two of our key OLAP experts (Stuart Bunby and Kevin Lancaster) helping deliver various OLAP workshops. Based on the questions and discussions I had with many people during this years OpenWorld I think it might be useful to share some of information we put together for those workshops via this blog. This series of postings (not sure how many it will be at this stage) are designed to take you from the OLAP basics right through to more advanced features such as creating your own calculations using the huge library of OLAP analytical functions and on to more DBA type topics such as monitoring cube data load and aggregation processes. I am hoping I can keep the flow of topics in the correct order....
Let’s start with the most obvious question “What Is OLAP”?
Online analytical processing (OLAP) is in my opinion a highly abused term that has lost much of its original meaning. In its original guise, dating from the early 1990’s, the term was used to describe a class of computer systems that were designed and optimized for analysis. This is still true of Oracle OLAP but not for many of the other proprietary solutions currently available in the marketplace.
From my perspective OLAP is about working with data in business terms without having to understand the underlying storage mechanism and having the ability to intelligently and transparently support the many different types of business rules that always exist within an organisation. For example, a very simple and obvious example is Stock. Most query tools do not understand how to correctly analyse stock over time, it is left to the user to select the correct aggregation method.
By using this term, it is possible to differentiate the more analytical requirements of the business analyst and senior management community from the requirements of the more general basic requirements that are easily and quickly answered by most directly query a transaction processing (OLTP) system. OLAP has now evolved into a more generic environment that is centred around use of the term “business intelligence”. Here the emphasis is more on “online” or active access as well as being far more “analytical” in terms of the reports that are generated.
What do these terms, online and analytical mean?
Online: Although most OLAP tools and applications enable development of reports that can be saved and printed when not connected to live data, OLAP emphasizes live access to data rather than static reporting. Analytic queries are submitted against the database in real time, and the results are returned in real time.
Analytical processing: This is the key concept with OLAP. End users can:
In contrast, OLAP systems are typically deployed to extend and enhance an organization’s ability to answer a much broader range of business questions about the data they are collecting in their transactional systems:
These questions are more analytical and complex, and the answer to one question often leads immediately to another question as the user follows a train of thought in researching a business problem or opportunity.
OLAP is designed to make it easy for end users to ask these types of analytical questions without requiring:

A typical multidimensional business query, would be something like the following:
For each region of the world, what was the percentage change in revenue for our top 20% products, over a rolling three-month period this year compared to the same period last year?
This simple business question describes both the data that the user wants to examine and the structural form of that data. Business users typically want to answer questions that include terms such as what, where, who, and when. For example, you find the following essential questions embedded in the sample question:
Now I think many people would agree this does in fact look like a complex query. To try and frame this within a traditional query and reporting tool would require considerable skill. And don’t forget this is the starting point for the analysis not the final result. The data returned by this query will drive other even more interesting and complex queries.
But the complexity of this query is a technical issue rather than a business issue.
Therefore, a key goal of OLAP technology is to make it very easy for end users to ask such questions about their data without placing a burden on the IT department.
How Does OLAP Make This Easy?
Business users think dimensionally. By design, OLAP technology stores, processes, and presents data in a dimensional way. The data model of OLAP systems reflects the users’ picture of their business data, making it easy to formulate queries in business terms.
OLAP systems are optimised for fast retrieval of data for dimensional analysis.
We will now examine the multidimensional logical model, which serves as the basis for OLAP systems.
The key Objects within the OLAP Model Most OLAP data models are built around two key concepts: measures and dimensions.
Measures
Measures represent factual data; they are sometimes called “facts.” Typical examples of measures are sales, cost, profit, and margin. Measures are organized by one or more dimensions. Many people visualize measures as being a simple cube type shape, in which the edges of the shape are the dimensions and the contents of the shape are the measure values. The image below shows a generic simple three dimensional measure.

Of course measures are not restricted to just three-dimensional definitions. A measure can have as many or as few dimensions as required to accurately manage the data associated with the measure. In additional Oracle’s OLAP option allows you to design and manage multiple cubes each with different dimensionality. In addition Oracle OLAP supports a number of different data types for measure such as: numeric (Oracle SQL data type), decimal, integer, text, date and boolean.
Measures can be divided into two categories:

Calculated measures are measures whose values are calculated dynamically at query time. Only the calculation rule(s) is stored in the database. Common calculations include measures such as ratios, differences, moving totals, and averages. Calculations do not require disk storage space, and they do not extend the processing time required for data maintenance.
Note: Oracle OLAP has a library of several hundred multidimensional calculation functions that can be used in calculated measures. It is even possible for expert users of Oracle OLAP to define their own functions to perform virtually any calculation.

From a business user perspective both measures appear and are used in exactly the same way and have equally as fast query access. All measures are equivalent as far as the end-user interface is concerned. However, it can be useful to at least provide them with the access to the definition of a calculated measure via a tooltip for example, just to avoid confusion.
Below is an example of a typical report contained both stored and calculated measures. The two calculated columns are “Profit” and “Margin”. Because both types of measures are treated the same, business users can use them in queries, conditions, to drive colour coding, exception reporting etc.

So what is the difference between a cube and a measure? If you have used Analytic Workspace Manager you will be familiar with the concept of a cube. This is a high level container, which is invisible to business users querying the OLAP data, for grouping together measures that share the same dimensionality. Cubes do make your life much easier in terms of being able to manage a whole group of measures collectively, store them all to an XML template, load data into a group of measures via single reference and so on.
Dimensions
Dimensions identify and categorize the data within your measures by forming the edges of the measures. Examples of dimensions include product, geography, time, and distribution channel.
Dimensions have three key components:
· Hierarchies
· Levels
· Attributes

With the Oracle OLAP data model, dimensions are stored once and are used repeatedly. This allows dimensions, and their members, to be shared across measures. While dimensions form the edge of a measure, the members point to individual cells inside the multi-dimensional measure, as can be seen above.
In the example below, there is just one Time dimension even though it appears three times. The three measures in the picture have different shapes, or dimensionality. Sales and Units are both dimensioned by the Customer, Product, and Time. Price is only dimensioned by Product and Time; it does not use the Customer dimension because the price does not vary by customer.

Hierarchies Dimension hierarchies are optional but are common in OLAP systems. A hierarchy is a logical structure that groups like members of a dimension together for the purpose of analysis. For example:

A dimension’s structure is organized hierarchically based on parent-child relationships. These relationships enable:

In this example, you can do the following in the Product hierarchy:
Levels Each level represents a position in the hierarchy. The level above the base level contains aggregate values for the levels below it. The members at different levels have a one-to-many parent-child relationship. A hierarchy typically contains several levels, and a single level can be included in more than one hierarchy.
If data for the Sales measure is stored at the Product level, then the higher levels of the product dimension enable the sales data to be aggregated correctly into Subcategory, Category, and All Products levels.
If there are multiple hierarchies built over a dimension, it may be that a level would appear in more than one hierarchy or may exist in only one hierarchy.

Types of Hiearchies Within a multi-dimensional model there are two basic types of hierarchies:
Sales forces also generally have a level-based structure, as in the following example:
Representative > Area > Region > Country > Continent > World
Other dimensions may have hierarchies that are not strictly level based. For example,
there is clearly a hierarchy in an organization chart, but all the direct reports of the President may not be at the same level. In the example, the two VPs (vice presidents) and the President’s Admin (administrative assistant) are all direct reports of the President but are not at the same level. The VPs are not at the Admin level, and the Admin is not at the VP level.

Attributes
Attributes provide descriptive information about the dimension members and are also useful when you are selecting dimension members for analysis:

In the above picture certain products are displayed together with their parent levels in the hierarchy (subcategories and categories) on the Product dimension. In addition, two sample attributes (Color and Product Manager) are displayed for these products.
Other examples of typical attributes might include:
For Product dimensions: Color, Flavor, Pack Size, Brand Manager Name, and so on
For Customer dimensions: Gender, Marital Status, Date of Birth, and other types of demographic information
Note: Sometimes, attributes may also be modeled as levels in an alternate hierarchy. Consider the above example: If the business requirement was that measures should be aggregated by Product Manager (total for Bruce, John, Karl, Mary, and so on.) or by Color (total for Blue, Green, Red, White, Yellow, and so on) and by the ability to drill down, aggregate, allocate, or calculate data based on these values, then many designers would consider creating additional hierarchies on the Product dimension for this purpose. However, many attributes have little business use as aggregates and are used simply in filtering.
What's coming next?
The next posting will provide an overview of the various products that can be used to build, maintain and query Oracle OLAP cubes.
Let’s start with the most obvious question “What Is OLAP”?
Online analytical processing (OLAP) is in my opinion a highly abused term that has lost much of its original meaning. In its original guise, dating from the early 1990’s, the term was used to describe a class of computer systems that were designed and optimized for analysis. This is still true of Oracle OLAP but not for many of the other proprietary solutions currently available in the marketplace.
From my perspective OLAP is about working with data in business terms without having to understand the underlying storage mechanism and having the ability to intelligently and transparently support the many different types of business rules that always exist within an organisation. For example, a very simple and obvious example is Stock. Most query tools do not understand how to correctly analyse stock over time, it is left to the user to select the correct aggregation method.
By using this term, it is possible to differentiate the more analytical requirements of the business analyst and senior management community from the requirements of the more general basic requirements that are easily and quickly answered by most directly query a transaction processing (OLTP) system. OLAP has now evolved into a more generic environment that is centred around use of the term “business intelligence”. Here the emphasis is more on “online” or active access as well as being far more “analytical” in terms of the reports that are generated.
What do these terms, online and analytical mean?
Online: Although most OLAP tools and applications enable development of reports that can be saved and printed when not connected to live data, OLAP emphasizes live access to data rather than static reporting. Analytic queries are submitted against the database in real time, and the results are returned in real time.
Analytical processing: This is the key concept with OLAP. End users can:
- Easily navigate multidimensional data to perform unpredictable ad hoc queries and to display the results in a variety of interesting layouts
- Transparently manage business rules across dimensions and cubes
- Drill through levels of detail to uncover significant aspects of data
- Rapidly and efficiently obtain the results of sophisticated data calculation and selection across multiple dimensions of data
In contrast, OLAP systems are typically deployed to extend and enhance an organization’s ability to answer a much broader range of business questions about the data they are collecting in their transactional systems:
- How do sales for our top 10 most profitable products across Europe for this quarter compare with sales a year ago?
- What are the differences in the product-sales mix between the regions, relative to the global sales mix?
- What are our forecast units, unit price per service, unit cost per product, sales, cost trends, and profit for the next 12 months?
- In what ways does the mix vary by salesperson, and what is the relative performance of our salespeople?
- What are the products making up 40% of our profit for each region over time?
These questions are more analytical and complex, and the answer to one question often leads immediately to another question as the user follows a train of thought in researching a business problem or opportunity.
OLAP is designed to make it easy for end users to ask these types of analytical questions without requiring:
- Assistance from the IT department
- Programming skills
- Technical knowledge about the organization of the database

A typical multidimensional business query, would be something like the following:
For each region of the world, what was the percentage change in revenue for our top 20% products, over a rolling three-month period this year compared to the same period last year?
This simple business question describes both the data that the user wants to examine and the structural form of that data. Business users typically want to answer questions that include terms such as what, where, who, and when. For example, you find the following essential questions embedded in the sample question:
- What products are selling best? (“…top 20%…”)
- Where are they selling? (“…each region of the world…”)
- When have they performed the best? (“…percentage change in revenue…”)
- There are two calculations (percentage change in revenue and rolling three-month total).
- There is a ranking element (the top 20% of products)
- There are aggregations (region level of the geography dimension)
- There are multidimensional selections (specific products, specific time periods, and specific regions)
- The result of the query is a multidimensional view of the data (perhaps as a tabular display on the screen, perhaps as a graph, or both)
Now I think many people would agree this does in fact look like a complex query. To try and frame this within a traditional query and reporting tool would require considerable skill. And don’t forget this is the starting point for the analysis not the final result. The data returned by this query will drive other even more interesting and complex queries.
But the complexity of this query is a technical issue rather than a business issue.
Therefore, a key goal of OLAP technology is to make it very easy for end users to ask such questions about their data without placing a burden on the IT department.
How Does OLAP Make This Easy?
Business users think dimensionally. By design, OLAP technology stores, processes, and presents data in a dimensional way. The data model of OLAP systems reflects the users’ picture of their business data, making it easy to formulate queries in business terms.
OLAP systems are optimised for fast retrieval of data for dimensional analysis.
We will now examine the multidimensional logical model, which serves as the basis for OLAP systems.
The key Objects within the OLAP Model Most OLAP data models are built around two key concepts: measures and dimensions.
Measures
Measures represent factual data; they are sometimes called “facts.” Typical examples of measures are sales, cost, profit, and margin. Measures are organized by one or more dimensions. Many people visualize measures as being a simple cube type shape, in which the edges of the shape are the dimensions and the contents of the shape are the measure values. The image below shows a generic simple three dimensional measure.

Of course measures are not restricted to just three-dimensional definitions. A measure can have as many or as few dimensions as required to accurately manage the data associated with the measure. In additional Oracle’s OLAP option allows you to design and manage multiple cubes each with different dimensionality. In addition Oracle OLAP supports a number of different data types for measure such as: numeric (Oracle SQL data type), decimal, integer, text, date and boolean.
Measures can be divided into two categories:
- Stored Measures
- Calculated (or derived) Measures

Calculated measures are measures whose values are calculated dynamically at query time. Only the calculation rule(s) is stored in the database. Common calculations include measures such as ratios, differences, moving totals, and averages. Calculations do not require disk storage space, and they do not extend the processing time required for data maintenance.
Note: Oracle OLAP has a library of several hundred multidimensional calculation functions that can be used in calculated measures. It is even possible for expert users of Oracle OLAP to define their own functions to perform virtually any calculation.

From a business user perspective both measures appear and are used in exactly the same way and have equally as fast query access. All measures are equivalent as far as the end-user interface is concerned. However, it can be useful to at least provide them with the access to the definition of a calculated measure via a tooltip for example, just to avoid confusion.
Below is an example of a typical report contained both stored and calculated measures. The two calculated columns are “Profit” and “Margin”. Because both types of measures are treated the same, business users can use them in queries, conditions, to drive colour coding, exception reporting etc.

So what is the difference between a cube and a measure? If you have used Analytic Workspace Manager you will be familiar with the concept of a cube. This is a high level container, which is invisible to business users querying the OLAP data, for grouping together measures that share the same dimensionality. Cubes do make your life much easier in terms of being able to manage a whole group of measures collectively, store them all to an XML template, load data into a group of measures via single reference and so on.
Dimensions
Dimensions identify and categorize the data within your measures by forming the edges of the measures. Examples of dimensions include product, geography, time, and distribution channel.
Dimensions have three key components:
· Hierarchies
· Levels
· Attributes

With the Oracle OLAP data model, dimensions are stored once and are used repeatedly. This allows dimensions, and their members, to be shared across measures. While dimensions form the edge of a measure, the members point to individual cells inside the multi-dimensional measure, as can be seen above.
In the example below, there is just one Time dimension even though it appears three times. The three measures in the picture have different shapes, or dimensionality. Sales and Units are both dimensioned by the Customer, Product, and Time. Price is only dimensioned by Product and Time; it does not use the Customer dimension because the price does not vary by customer.

Hierarchies Dimension hierarchies are optional but are common in OLAP systems. A hierarchy is a logical structure that groups like members of a dimension together for the purpose of analysis. For example:
- A Time dimension might have a hierarchy that describes how months are grouped together to represent a quarter and how quarters are grouped together to represent a full year.
- An Organization dimension might have a hierarchy that makes it easy for you to identify the direct reports of a specific manager.

A dimension’s structure is organized hierarchically based on parent-child relationships. These relationships enable:
- Navigation between levels: Hierarchies on dimensions enable drilling down to lower levels or navigating (rolling up) to higher levels. Drilling down on the Time dimension member “2005” will likely navigate you to the quarters Q1 2005 through Q4 2005. In a calendar year hierarchy, drilling down on Q1 2005 would navigate you to the months January 05 through March 05. These kinds of relationships make it easy for users to navigate large volumes of multidimensional data.
- Aggregation from child values to parent values: The parent represents the aggregation of its children. Data values at lower levels aggregate into data values at higher levels. Dimensions are structured hierarchically so that data at different levels of aggregation can be manipulated together efficiently for analysis and display. You learn about the aggregation capabilities of Oracle OLAP in the lesson titled “Applying Advanced Dimensional Design and Cube Processing Techniques.”
- Allocation from parent values to child values: The reverse of aggregation is allocation and is heavily used by planning, budgeting, and similar applications. Here, the role of the hierarchy is to identify the children and descendants of particular dimension members for “top-down” allocation of budgets (among other uses).
- Grouping of members for calculations: Share and index calculations take advantage of hierarchical relationships (for example, the percentage of total profit contributed by each product, or the percentage share of product revenue for a certain category, or costs as a percentage of the geographical region for a retail location).

In this example, you can do the following in the Product hierarchy:
- Navigate up through each level in the hierarchy from the lowest level to the highest level
- Navigate down the hierarchy from the highest level to the lowest level
- Aggregate data from the lowest level (individual products) up through the hierarchy to the highest level (total product)
Levels Each level represents a position in the hierarchy. The level above the base level contains aggregate values for the levels below it. The members at different levels have a one-to-many parent-child relationship. A hierarchy typically contains several levels, and a single level can be included in more than one hierarchy.
If data for the Sales measure is stored at the Product level, then the higher levels of the product dimension enable the sales data to be aggregated correctly into Subcategory, Category, and All Products levels.
If there are multiple hierarchies built over a dimension, it may be that a level would appear in more than one hierarchy or may exist in only one hierarchy.

Types of Hiearchies Within a multi-dimensional model there are two basic types of hierarchies:
- Level Based
- Value Based
Sales forces also generally have a level-based structure, as in the following example:
Representative > Area > Region > Country > Continent > World
Other dimensions may have hierarchies that are not strictly level based. For example,
there is clearly a hierarchy in an organization chart, but all the direct reports of the President may not be at the same level. In the example, the two VPs (vice presidents) and the President’s Admin (administrative assistant) are all direct reports of the President but are not at the same level. The VPs are not at the Admin level, and the Admin is not at the VP level.

Attributes
Attributes provide descriptive information about the dimension members and are also useful when you are selecting dimension members for analysis:
- Select the products whose color (attribute) is “Blue.”
- Select the customers who have two children.
- Select the promotions that are of type “Multipack.”
- Select all time periods whose description contains “January.”

In the above picture certain products are displayed together with their parent levels in the hierarchy (subcategories and categories) on the Product dimension. In addition, two sample attributes (Color and Product Manager) are displayed for these products.
Other examples of typical attributes might include:
For Product dimensions: Color, Flavor, Pack Size, Brand Manager Name, and so on
For Customer dimensions: Gender, Marital Status, Date of Birth, and other types of demographic information
Note: Sometimes, attributes may also be modeled as levels in an alternate hierarchy. Consider the above example: If the business requirement was that measures should be aggregated by Product Manager (total for Bruce, John, Karl, Mary, and so on.) or by Color (total for Blue, Green, Red, White, Yellow, and so on) and by the ability to drill down, aggregate, allocate, or calculate data based on these values, then many designers would consider creating additional hierarchies on the Product dimension for this purpose. However, many attributes have little business use as aggregates and are used simply in filtering.
What's coming next?
The next posting will provide an overview of the various products that can be used to build, maintain and query Oracle OLAP cubes.
Subscribe to:
Posts (Atom)