A few things are obvious at first glance:
- It is a pie chart with a 3D effect.
- This is an Excel generated chart.
- There is redundancy in the chart: the slice labels contain the operator name, and then the legend at the bottom repeats the same information.
- The data is not sorted, so even if you could somehow compare these 3D slices, you would have a tough time finding which is the largest slice, which is the second largest slice, and so on.
- To find the largest slice, you are better off simply comparing the numbers. Which makes the chart itself quite unnecessary.
- The color scheme is very Excel-ish, which is to say, quite unpleasing to the eye. Excel 2007 is an improvement, for sure.
- There are black borders around the slices, which do not make the chart any better.
How to improve this?
Here are some examples:
Example 1:
You cannot really go wrong with a bar chart. This bar chart displays the same data, except now as a bar chart. Straight off you can tell from a visual inspection that "Tata" added the most subscribers, close to 25% of the net additions in October 2009.
Example 2:
I have now added data labels at the top of each bar. This makes it possible to see the precise values for each operator.
Example 3:
By now, it is clear that sorting the bars would make the data a lot more easily digestable. So what insights are now possible with this example? For one, that Reliance and Aircel and even Idea are two operators that added almost the same number of subscribers. Not very obvious from the above examples. Aircel is a relatively new operator, but seems to be growing quite fast, thanks to its aggressive advertising.
Second Chart:
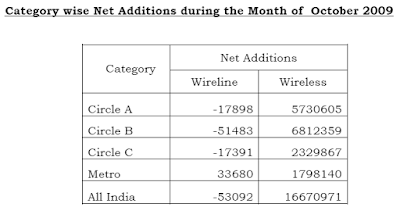
This table above shows "Category wise Net Additions during the Month of October 2009'.
Notwithstanding the fact that the data here would be a lot more easy to understand if it had been formatted with commas, let us see how it may be visualized as a chart:
This chart does one thing well. It gives a sense of the difference in scale between the wireline and wireless segments. The wireless segment is growing by millions, in every circle, while the wireline segment is in decline. The decline is however minuscule. And without labels, it is difficult to gauge even the approximate values.
So, if I plot this now as a percent stacked bar chart, it looks like an improvement. What I have done is added labels to each stack. I can now see that the Metro segment showed a rise, while the other three segments showed a decline in the wireless segments.
However, this chart is sort of misleading, because it makes the wireline and wireless segments appear equal. Which, as we saw, is most certainly not the case.
As the third example, I have now plotted the same data as a stacked vertical bar chart. Not as a percent stacked chart, but simply taken the absolute values and stacked them.
The vertical chart brings out quite nicely the difference in magnitude between the wireline and wireless segments.
A problem existed for this chart also. Which is that the categories for the wireline segment are so small, that the individual stacks are barely visible, even on a chart as tall as this one. So, I have added data labels, and then manually moved the labels so that they don't overlap.


