Pages

Friday, July 28, 2006

OracleBI Spreadsheet Add-in advantages

Thanks for the introduction Abhinav...:)

I will start out with highlighting some of the advantages of using the OracleBI Spreadsheet Add-in. They might not all be quite obvious, but you will appreciate them when you use the product.

Ease of use.

  • It installs really easily. Just run the .exe file, walk through the wizard and you are done. Start Excel, and you will see the OracleBI menu.
  • We have tried to make the product intuitive to use, so the user can use familiar Excel functions. More on this below.

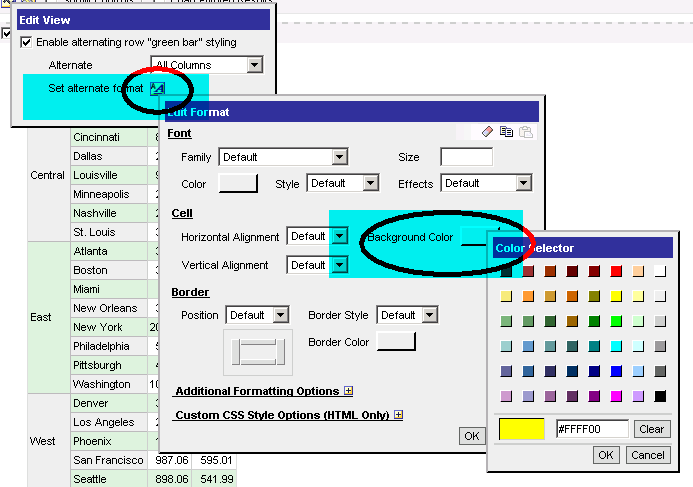
Formatting and printing.

  • You have finegrained control over the appearance of the data. Essentially, you have full control over the format for each individual cell, as you do in Excel
  • You can move the Query area around within the sheet using cut/paste, to make space for Charts, formulas etc.
  • You can then print the worksheet as a nicely formatted report. Although you don't have pixel perfect control, it is good enough for most purposes, and you still have live, refreshable data.

Extended analysis.

  • Add Excel formulas into the Query area just by inserting rows and columns. The add-in will preserve the formulas even when drilling, provided that the cell references are still there.
  • You can create formulas that combine data from OLAP with data from other sheets, which could be external data. This is not possible with the built-in Calculation Wizard.
  • On the other hand, the Calcuation Wizard enables you to create easily calculations such as 'Variance from Last year' without the need for downloading last years data to Excel first. The calculation runs in the OLAP Server where the data is stored, making this possible.

Using VBA.

  • The data is written into the Excel cells, just as if you typed it in, so if you have VBA skills, you can perform additional processing of data by looping through the cells, comparing with other data, creating charts of the data etc. We have added support for some new VBA calls in the upcoming release that will help you with this type of thing.

Multiple queries and databases.

  • It is possible to create multiple queries in a Worksheet, and even multiple queries against multiple databases in a workbook. This is a quite unique feature.
  • In the new release there is be a Refresh Workbook/ Refresh Worksheet feature to make it easier to reconnect multiple queries. If there are multiple connections, the login dialog will be displayed as needed.

Write-back to Oracle OLAP cubes.

  • Write-back has been added in the upcoming release. The OracleBI Spreadsheet Add-in is currently the only Oracle product that does this, short of building your own java application with BI Beans and JDeveloper. This is not trivial, as there are lots of things you have to take into account in designing your cubes and your workbooks, but this is a major feature.

Friday, July 14, 2006

And a new BI blogger

I am very happy to announce that very soon we shall have another Oracle BI product manager start posting on the Orale BI blog. Aneel Shenker is a product manager based out of Oracle's Burlington development center and is responsible among other things for the BI Spreadsheet Add-In. The latest release of the Spreadsheet Add-In, just round the corner, features some cool enhancements that you shall be reading about from Aneel himself. Here's welcoming Aneel!

Row Banding in Oracle Answers

Row banding is something that is used frequently to help make multi-row data more readable. That is a truism.
Oracle Answers (part of Oracle Business Intelligence Enterprise Edition) has support for row banding.
Here's a quick example:
This is a crosstab (called "Pivot Table" in Answers) built on the Video Stores schema. Here the report is grouped by "Region", and the measures are "Sales" and "Profit". "City" is the other item. The report is paged by "Product Description".

By default this check box is checked off. But I can check it on to enable banding. The default color here is "green bar", and the alternate banding applies only to the innermost columns. Simply speaking this means that it will apply to the non grouped items.

This should make it clearer. Region is not banded as it is a grouped item. City, Sales, and Profit are.


If I now choose the "All Columns" option from the dropdown, the banding applied is as shown below.
As you can see, even the Region column is now included in the alternate row banding.

Not that I am restricted only to the light green color. I can go and set an alternate format. I select a bright yellow (would this be canary yellow? probably not... let's call it bright yellow)


Voila - here is my color banding in yellow now. Bright yellow at that.

Free OWB and DM Review seminar

Too embarassed to even explain why I have not blogged for almost a month... If I say there has been a lot of work, does it mean that BI blogging is not work? Or if I say I have been lazy, does it mean that I have been lazy in general, at work also? Let's just say that blogging is going to be a bit slow in the coming weeks till some things are sorted out and I get a better handle on some new projects I am taking on.

Oracle Warehouse Builder 10g release 2 (link to product page on OTN) released last month, and DM Review is conducting a free web seminar (sponsored by Oracle) on OWB titled "Moving Beyond ETL with Oracle Warehouse Builder: Providing Data Integration and Data Quality". It will be held on Wednesday, July 26th, 2006, at 2:00 p.m. ET / 11:00 a.m. PT. It shall feature Mary Jo Nott from DM Review and Paul Narth from OWB product management.


The link to the registration page: http://www.dmreview.com/web/reg_oracle0306.cfm