Tim Dexter runs an excellent blog here. It contains great content on BI Publisher, and if you have questions on BI Publisher, or think you have questions on BI Publisher, then that's the place to go. Of course, you don't have to, you can stay here on this blog too... but I am trying to be helpful here.
In case you want to catch up on the latest and greatest new features in the 10.1.3.3 release of BI Publisher, while you can always download the software from OTN, or go to the OTN page here, you should also bookmark or subscribe to the BIP blog's RSS feed.
Tuesday, August 21, 2007
Monday, August 20, 2007
BI Office in 10.1.3.3 - Clipboard
What's this clipboard you keep talking about?
The clipboard (we don't really have an official name for it) lets you copy BI views from Answers or Dashboards and into Excel or PowerPoint using the BI Office Add-in as native Office charts or tables. It makes inserting BI content into Office documents simple as 1-2 (one-click to copy, one-click to paste).
The beginning:
As a sort of history into the evolution of this feature, when we first started discussing it last year, we wanted to implement something different, a sort of a Windows independent clipboard. People would be able to copy a BI object into the clipboard from Answers or Dashboards, and then a user from Excel or PowerPoint would access that network based clipboard, and insert views. Some iterations later, after discussions between the development teams – the BI Office and the Presentation Services teams – we realized that we could do it in an easier and more user-friendly way. What if we simply copied, into the Windows clipboard, the fully qualified name and path to the BI view that you copied. That would read something like "#shared/Paint Demo/Sales Summaries/Regional Analysis/Regional Revenue|ChartView1" for a chart view named 'ChartView1' in request named "Regional Revenue" that was located under the Shared : Paint Demo : Sales Summaries : Regional Analysis folder path.. Since it was in your Windows clipboard, you wouldn’t need a separate component or product to manage its contents. That worked quite well. Till we started thinking some more. (yes, insightful thought is really a binary process... it can be off for stretches of time, and then when it switches on it can cause a lot of Eureka moments, and some of them with clothes on. Note to self: STOP with these non-sequiturs.) The thought was, wouldn’t it be really, really nice if we could allow users to copy a view in any state (as in let them copy when they are in California, Nevada, Karnataka, and so on). Huh? (Abhinav - these silly and infantile witticisms were cute the first hundred times, not any more!). Let me explain. Consider a Dashboard page. Let’s take the demo Dashboard page that ships with the product.
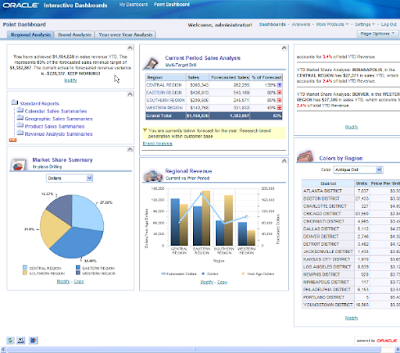
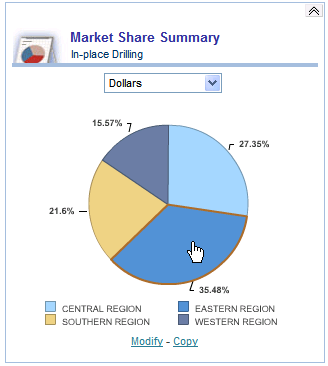
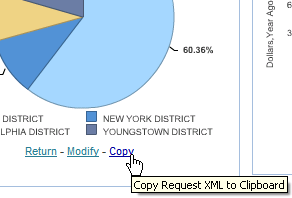
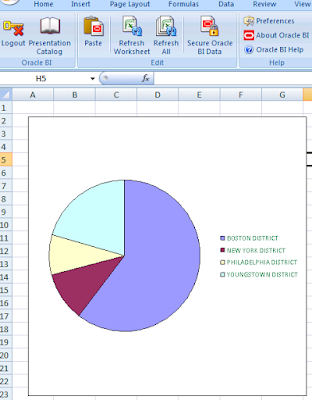
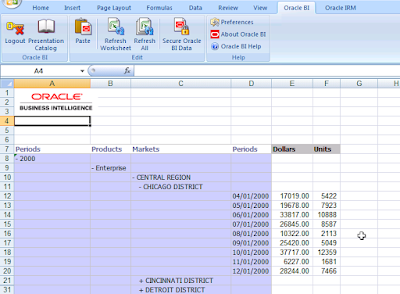
In-place drilling: Now, on this page I can do at least two different things as they relate to the BI clipboard functionality. Firstly, I can do an in-place drill into a view. Take this pie chart for example, that displays dollar sales by region:
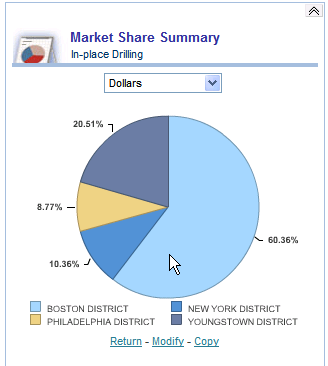
I can drill into the 'Eastern Region' so that it now displays the breakup of sales for the districts in the 'Eastern Region':
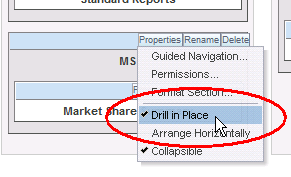
How to setup in-place drilling:
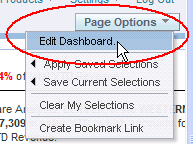
I got an in-pace drill here because that’s the way the chart has been setup in Dashboards. If you were to edit the dashboard, this is what you would see:
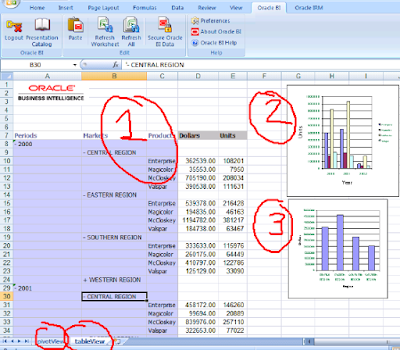
Copying the state of a view:
At this point, this chart has changed from its original definition.
While the original chart showed me dollar sales by region (the SQL would be: SELECT Markets.Region saw_0, "Sales Measures".Dollars saw_1 FROM Paint ORDER BY saw_0), (see below)

this drilled chart is showing me dollar sales for districts in the 'Eastern Region' (the SQL is: SELECT Markets.Region saw_0, "Markets"."District" saw_1, "Sales Measures".Dollars saw_2 FROM Paint WHERE "Markets"."Region" = 'EASTERN REGION' ORDER BY saw_0, saw_1).
If I were to have my BI clipboard working like it was designed initially, you would not be able to copy this modified view. What would get copied would be the original definition of the view. You would copy the chart and when pasted inside Excel or PowerPoint, it would be the chart with sales by region. Good, but not quite there, right? There’s got to be a better way. And indeed there is. What helped was the knowledge that the presentation services framework has a pretty good state management capability that the BI Office product and the clipboard could leverage. What do I mean? Well, consider this: when I click the 'print' link/button on a Dashboard page, the state of the Dashboard page is maintained and passed to the server that then generates a PDF or HTML version of the dashboard page, sans the header and other chrome that is unwanted in a printer-friendly version of the page. What the team then decided is, let’s copy the state of the chart into the clipboard. What I mean is, the chart in its current state – sales by district for 'Eastern' region – can be represented by appropriate XML that describes the chart, its format, as well as the metadata that it is displaying. Cool! What does it look like? It? The XML I mean.
The XML
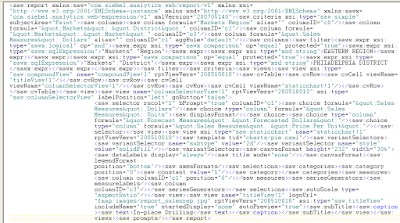
Ewww. That’s not nice. This is not fit even for a PG audience. But you asked for it, sir. The XML is not pretty, but at least you can scan through it to notice some things that the XML contains:

- the name of the subject area: 'Paint'
- the columns contained in the request (dollars, region, district)
- the filter (on region)
- the filter value: 'EASTERN REGION'
- all the views contained in the request - the compound view, the title view, the chart view, the column selector, etc...
- details about the chart view, including the sub-type (2D), the fill color, etc...
If you copy this view, and then paste it in Excel or PowerPoint using the BI Office Add-in's 'Paste' button, the BI Office ‘Paste’ button can turn this XML into something pretty in a jiffy, like this:
Ah. That’s good. I likes it.
What else can I do with the clipboard?
Well... let’s see. You can’t take it home to your mom. Nor can you take it out on a date. But you can go to PowerPoint and paste it there. The BI clipboard can take the same XML and turn it into beautiful Office charts in both Excel and PowerPoint. Let me correct that – it can turn XML into Office charts in both Excel and PowerPoint.
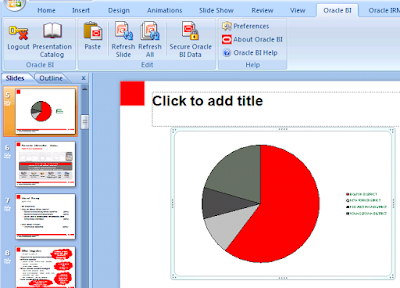
The chart above has inherited the color scheme of the PowerPoint template I am using.
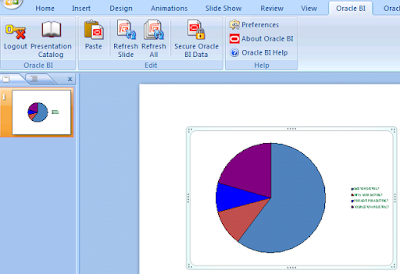
The chart above has inherted the default color scheme as this is a new PowerPoint presentation.
Pasting a Table View
That’s all fine. A picture is worth a thousand words. But what if I wanted those actual thousand words? What if I wanted a table to be pasted into Excel? With many rows. Many, many rows, more than a thousand rows? Well... be my guest.
Take this longer-than-a-picture table with close to 1200 rows.
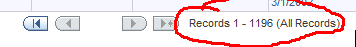
Copy it.
Go to Excel and paste it.
There you go.
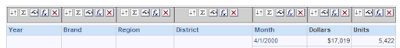
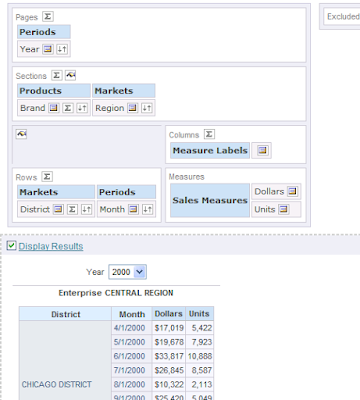
Pasting a Pivot View
Not happy with a table? Prefer a Pivot View? No problem.
Here’s the Answers Pivot View.
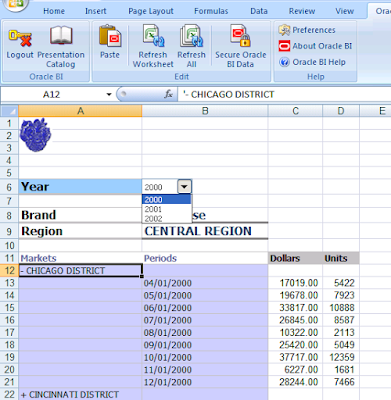
And here’s the pasted view pasted in Excel:
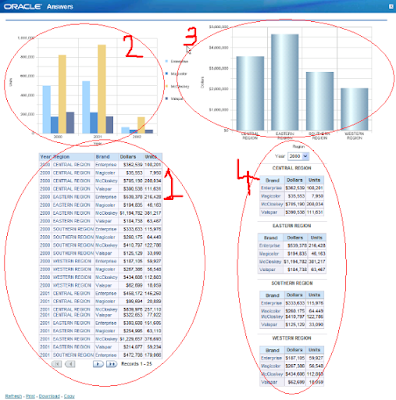
I see. Obviously, Abhinav, you are showing things that you had thought of. Yes sir, and that was quite an effort. But what about compound views? What if I had a table, and a chart, and another table, and a pivot view, and yet another chart, and .... yeah yeah yeah – I see you like compound views. Let’s take a case. Is this the sort of compound view you were referring to?
Yes. Ok. Sure.
No problem.
1 click to copy.
1 click to paste.
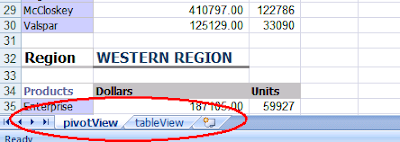
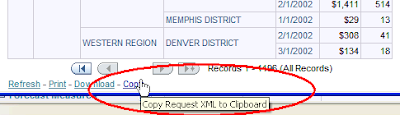
Each table view and pivot view is pasted onto a separate Excel sheet. The chart views can share the same sheet as a table or pivot view. Therefore, in this case, the four views from the request in Answers have been pasted onto two sheets in Excel.
But wait! I saw something there!!! What’s this?
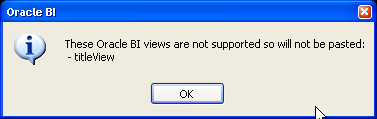
That sir, is not a wardrobe malfunction (wouldn't that be embarassing?). It’s not even a clipboard malfunction. The honest fact of the matter is (you know I am upto no good when I preface a sentence with ‘to be perfectly honest’, ‘frankly speaking’) that we do not yet support all the views known to the Presentation Services. Therefore, we do not sneak around by not even telling you that these views have not been pasted.
Ok, ok, Mahatma Gandhi. But this may get on my nerves. Seeing this message everytime I paste a BI view that contains a title view.
I agree.
So are you going to do something about it??
Yes.
What?
Go here:
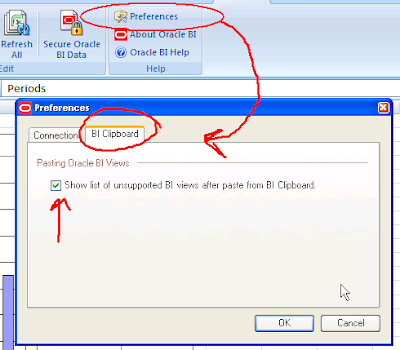
Check this box, or uncheck it to not see the message about unsupported views.
And that marks the end of the post on the BI clipboard.
IOW, Elvis has left the building.
The clipboard (we don't really have an official name for it) lets you copy BI views from Answers or Dashboards and into Excel or PowerPoint using the BI Office Add-in as native Office charts or tables. It makes inserting BI content into Office documents simple as 1-2 (one-click to copy, one-click to paste).
The beginning:
As a sort of history into the evolution of this feature, when we first started discussing it last year, we wanted to implement something different, a sort of a Windows independent clipboard. People would be able to copy a BI object into the clipboard from Answers or Dashboards, and then a user from Excel or PowerPoint would access that network based clipboard, and insert views. Some iterations later, after discussions between the development teams – the BI Office and the Presentation Services teams – we realized that we could do it in an easier and more user-friendly way. What if we simply copied, into the Windows clipboard, the fully qualified name and path to the BI view that you copied. That would read something like "#shared/Paint Demo/Sales Summaries/Regional Analysis/Regional Revenue|ChartView1" for a chart view named 'ChartView1' in request named "Regional Revenue" that was located under the Shared : Paint Demo : Sales Summaries : Regional Analysis folder path.. Since it was in your Windows clipboard, you wouldn’t need a separate component or product to manage its contents. That worked quite well. Till we started thinking some more. (yes, insightful thought is really a binary process... it can be off for stretches of time, and then when it switches on it can cause a lot of Eureka moments, and some of them with clothes on. Note to self: STOP with these non-sequiturs.) The thought was, wouldn’t it be really, really nice if we could allow users to copy a view in any state (as in let them copy when they are in California, Nevada, Karnataka, and so on). Huh? (Abhinav - these silly and infantile witticisms were cute the first hundred times, not any more!). Let me explain. Consider a Dashboard page. Let’s take the demo Dashboard page that ships with the product.

In-place drilling: Now, on this page I can do at least two different things as they relate to the BI clipboard functionality. Firstly, I can do an in-place drill into a view. Take this pie chart for example, that displays dollar sales by region:


I got an in-pace drill here because that’s the way the chart has been setup in Dashboards. If you were to edit the dashboard, this is what you would see:


At this point, this chart has changed from its original definition.
While the original chart showed me dollar sales by region (the SQL would be: SELECT Markets.Region saw_0, "Sales Measures".Dollars saw_1 FROM Paint ORDER BY saw_0), (see below)


The XML


- the name of the subject area: 'Paint'
- the columns contained in the request (dollars, region, district)
- the filter (on region)
- the filter value: 'EASTERN REGION'
- all the views contained in the request - the compound view, the title view, the chart view, the column selector, etc...
- details about the chart view, including the sub-type (2D), the fill color, etc...


Ah. That’s good. I likes it.
What else can I do with the clipboard?
Well... let’s see. You can’t take it home to your mom. Nor can you take it out on a date. But you can go to PowerPoint and paste it there. The BI clipboard can take the same XML and turn it into beautiful Office charts in both Excel and PowerPoint. Let me correct that – it can turn XML into Office charts in both Excel and PowerPoint.

The chart above has inherited the color scheme of the PowerPoint template I am using.

The chart above has inherted the default color scheme as this is a new PowerPoint presentation.
That’s all fine. A picture is worth a thousand words. But what if I wanted those actual thousand words? What if I wanted a table to be pasted into Excel? With many rows. Many, many rows, more than a thousand rows? Well... be my guest.
Take this longer-than-a-picture table with close to 1200 rows.


Pasting a Pivot View
Not happy with a table? Prefer a Pivot View? No problem.
Here’s the Answers Pivot View.


Yes. Ok. Sure.
No problem.
1 click to copy.
1 click to paste.


But wait! I saw something there!!! What’s this?

Ok, ok, Mahatma Gandhi. But this may get on my nerves. Seeing this message everytime I paste a BI view that contains a title view.
I agree.
So are you going to do something about it??
Yes.
What?
Go here:

Check this box, or uncheck it to not see the message about unsupported views.
And that marks the end of the post on the BI clipboard.
IOW, Elvis has left the building.
BI Publisher Discoverer integration 2
Let’s take a little closer but brief look at this entire integration (between BI Publisher and Discoverer of course!) in a little more detail.
Architecture, configuration, optimizations, all come a bit later - let's approach this from a more end user perspective.
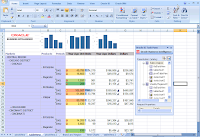
This below is a Discoverer worksheet. A table actually. Shows me Profits, Sales, by Year, Region, and City. Plain vanilla report - took me less than five minutes to create it (probably closer to two, but then I was not timing myself).

This Discoverer worksheet also has two parameters (parameters are the equivalent of conditions whose values are specified and applied at run time) - one on Year and the other on Region. For those coming from the BI EE world (that would be Business Intelligence Enterprise Edition), parameters are the equivalent of 'prompts' in Answers. And these parameters have LOVs (that would be “List of Values”, and not some vulgarism or cute colloquialism).
The two parameters also have default values - 1998 for Year, and 'West' for Region. This is useful for reasons we shall see later (in other words - 'trust me, I know what I am doing').

What I want to do is create a report in BI Publisher that uses this Discoverer worksheet as the data source.
While I go about describing that process here, please do excuse my graphical loquacity (i.e. I shall use more screenshots than you may need or want, but this isn't about needs or wants).
Go to BI Publisher and create a new report under a folder of your choice.
But first you have to login.

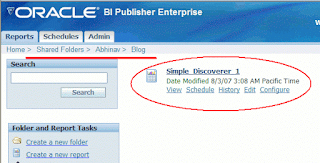
Here is the folder I created ("Blog" under "Abhinav" under "Shared Folders").
And the report I created is "Simple_Discoverer_1" (I do have a gift with names).

Now, this report is empty. No data, no template.
So if you click the "View" link above, you would see that the report template dropdown is blank, and clicking "View" would return nothing.

This is good, because you do not want an empty report with no data and no layout to get possessed...
What we need to do first is specify where the data is coming from. We know where the data is coming from – a Discoverer worksheet – but we need to tell BI Publisher that, right? Prescient computing is still some ways off (hmm... there's an idea).
Create a new data model first. That sounds difficult? No it isn’t. Simply click 'Data Model' and then click the 'New' icon.

After you do that, select ‘Discoverer’ from the dropdown (here you see the first glimpse of the functionality that is new in BI Publisher and germane to this post on Discoverer integration), and then click the two searchlights/torchlights and pick your Discoverer connection and workbook/worksheet.

See all the arrows in the screenshot below? After your data set has been defined, click 'Save' (would it be a good idea to have an 'auto-save' type functionality here?)

Done that? Good. You are good to go – at least in terms of viewing your data via BI Publisher. Click the 'View' link and you can already see a couple of things.
Firstly, the Discoverer parameters are now available here in BI Publisher. And the default values have been pre-selected.
Secondly, since I had specified in the Discoverer workbook that these parameters could accept multiple values, the LOV in BI Publisher appears as a multi-select list box. If these had been single value parameters, these would have been dropdowns so you could select only one value.

Thirdly, you can view the data, but there is no formatting or layout, still. That again is expected. After all, we haven't associated a template with this report yet. But you can see the XML here. It's in a rowset form, and the Discoverer web services have done this. And this is perhaps the most critical part of the whole integration. It doesn't really matter how the data gets from Discoverer to BI Publisher, as long as it is in this format - rowset - that BI Publisher understands and can work with.

Scheduling and Distribution
Before we (I am using the royal pronoun here... there's only me writing this post, right?) get into the template building part where you can use the formatting capabilities of Microsoft Word to create nice looking reports with BI data in it, let’s see just what we can do with this bare bones report that has no template associated with it.
Specifically, I want to try out two things (things always have to be exposited in twos and threes when I speak - annoying habit).
Firstly, and this is what many Discoverer customers want to do; schedule and distribute Discoverer content to users.
So, click the ‘Schedule’ button, which takes you to the BI Publisher scheduler. There, change the parameters if you want to, or leave them as they are. Set up a schedule – for convenience I chose to run the job immediately. Furthermore, specify that you want to destination to be email. My email. But of course.


All done? Click the ‘History’ link, and there is my scheduled job, with a green status icon of ‘Success’ (I thought of another non-sequitur on 'success' and 'green', but let's leave that for another day).

Now all I have to do is wait for the email. And there it is. In my inbox – I see the mail, and there is the attachment – “attachment.xml”.

- a Hindi movie reference if you must know).
Architecture, configuration, optimizations, all come a bit later - let's approach this from a more end user perspective.
This below is a Discoverer worksheet. A table actually. Shows me Profits, Sales, by Year, Region, and City. Plain vanilla report - took me less than five minutes to create it (probably closer to two, but then I was not timing myself).

The two parameters also have default values - 1998 for Year, and 'West' for Region. This is useful for reasons we shall see later (in other words - 'trust me, I know what I am doing').

While I go about describing that process here, please do excuse my graphical loquacity (i.e. I shall use more screenshots than you may need or want, but this isn't about needs or wants).
Go to BI Publisher and create a new report under a folder of your choice.
But first you have to login.

Here is the folder I created ("Blog" under "Abhinav" under "Shared Folders").
And the report I created is "Simple_Discoverer_1" (I do have a gift with names).


This is good, because you do not want an empty report with no data and no layout to get possessed...
Create a new data model first. That sounds difficult? No it isn’t. Simply click 'Data Model' and then click the 'New' icon.


See all the arrows in the screenshot below? After your data set has been defined, click 'Save' (would it be a good idea to have an 'auto-save' type functionality here?)

Done that? Good. You are good to go – at least in terms of viewing your data via BI Publisher. Click the 'View' link and you can already see a couple of things.
Firstly, the Discoverer parameters are now available here in BI Publisher. And the default values have been pre-selected.
Secondly, since I had specified in the Discoverer workbook that these parameters could accept multiple values, the LOV in BI Publisher appears as a multi-select list box. If these had been single value parameters, these would have been dropdowns so you could select only one value.

Thirdly, you can view the data, but there is no formatting or layout, still. That again is expected. After all, we haven't associated a template with this report yet. But you can see the XML here. It's in a rowset form, and the Discoverer web services have done this. And this is perhaps the most critical part of the whole integration. It doesn't really matter how the data gets from Discoverer to BI Publisher, as long as it is in this format - rowset - that BI Publisher understands and can work with.

Scheduling and Distribution
Before we (I am using the royal pronoun here... there's only me writing this post, right?) get into the template building part where you can use the formatting capabilities of Microsoft Word to create nice looking reports with BI data in it, let’s see just what we can do with this bare bones report that has no template associated with it.
Specifically, I want to try out two things (things always have to be exposited in twos and threes when I speak - annoying habit).
Firstly, and this is what many Discoverer customers want to do; schedule and distribute Discoverer content to users.
So, click the ‘Schedule’ button, which takes you to the BI Publisher scheduler. There, change the parameters if you want to, or leave them as they are. Set up a schedule – for convenience I chose to run the job immediately. Furthermore, specify that you want to destination to be email. My email. But of course.


Friday, August 17, 2007
BI Office in 10.1.3.3
One of the two biggest features in the 10.1.3.3 release is the Office Add-in - properly known as 'Oracle Business Intelligence for Microsoft Office' (see other posts on 10.1.3.3)
You can go to OTN to download the software (see this post for download links).
This is the New Features doc, which has a chapter on the Office Add-in.
And once you install the client add-ins you can view the online help too - these are available as CHM files from the add-in's help menu.
So what's new in the new Add-in (is that a tautology)?
I can rattle off many, many features in BI Office, but for my money I would pick these four:
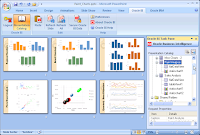
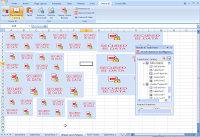
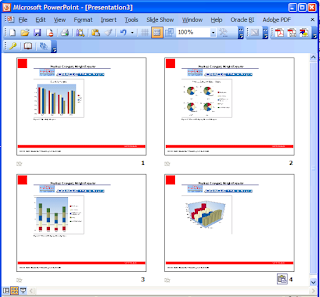
Consider these screenshots of PowerPoint with charts inserted using the BI Office Add-in.
The first screenshot shows you six slides, all charts.
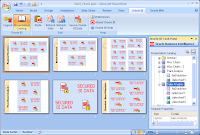
The second screenshot above, on the right, shows the same presentation secured using the 'Secure Oracle BI Data' button.
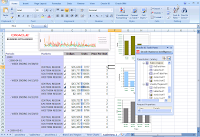
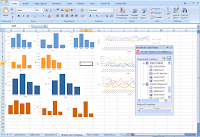
Here below is a similar screenshot of the BI Office Add-in with Microsoft Excel 2007. I have multiple worksheets in the workbook, each has a combination of tables, native Office charts, BI charts inserted as images. You can notice that some of the charts are the same as the ones I used in the presentation screenshots above. Of course - BI charts are available in both Excel and PowerPoint. Also visible is the BI Presentation catalog that you use to browse your requests and insert them into your spreadsheets.
The other nice feature is the Secure feature. One-click. Again. One click is what it takes to secure an Excel sheet. Tables, flat data views, charts, images, all. One click is what it takes to secure an entire PowerPoint presentation - tables, charts, images, even Flash objects. And one-click to refresh. Take a look:
This below is a worksheet from the same Excel file that I showed above.
With a single click (well... you could argue that buttons are meant to be clicked once, but I have had the misery of knowing and working for people who would double-click twice on buttons as well as hyperlinks, and they have done quite well in life too, so maybe that's what I have been doing wrong all these years: not double-clicking on links and buttons) I can secure all the data in the worksheet.

And with a single click again, I can choose to refresh the worksheet or the entire workbook.
And with that ends the first episode.
I shall be back (or does it sound more convincing were I to say "I'll be back"?)
You can go to OTN to download the software (see this post for download links).
This is the New Features doc, which has a chapter on the Office Add-in.
And once you install the client add-ins you can view the online help too - these are available as CHM files from the add-in's help menu.
So what's new in the new Add-in (is that a tautology)?
I can rattle off many, many features in BI Office, but for my money I would pick these four:
- A revamped Excel Add-in and a new PowerPoint Add-in.
- Ability to insert BI charts as refreshable images or even Flash objects.
- A really, really, nice feature that we call the BI Clipboard.
- Ability to drilling in Excel tables in offline mode.
Consider these screenshots of PowerPoint with charts inserted using the BI Office Add-in.
The first screenshot shows you six slides, all charts.


The second screenshot above, on the right, shows the same presentation secured using the 'Secure Oracle BI Data' button.
Here below is a similar screenshot of the BI Office Add-in with Microsoft Excel 2007. I have multiple worksheets in the workbook, each has a combination of tables, native Office charts, BI charts inserted as images. You can notice that some of the charts are the same as the ones I used in the presentation screenshots above. Of course - BI charts are available in both Excel and PowerPoint. Also visible is the BI Presentation catalog that you use to browse your requests and insert them into your spreadsheets.


The other nice feature is the Secure feature. One-click. Again. One click is what it takes to secure an Excel sheet. Tables, flat data views, charts, images, all. One click is what it takes to secure an entire PowerPoint presentation - tables, charts, images, even Flash objects. And one-click to refresh. Take a look:
This below is a worksheet from the same Excel file that I showed above.
With a single click (well... you could argue that buttons are meant to be clicked once, but I have had the misery of knowing and working for people who would double-click twice on buttons as well as hyperlinks, and they have done quite well in life too, so maybe that's what I have been doing wrong all these years: not double-clicking on links and buttons) I can secure all the data in the worksheet.


And with a single click again, I can choose to refresh the worksheet or the entire workbook.

And with that ends the first episode.
I shall be back (or does it sound more convincing were I to say "I'll be back"?)
BI Publisher Discoverer integration
I shall talk a bit about the benefits of the integration between BI Publisher and Discoverer in the 10.1.3.3 release, and how that shall be of interest to people who want to create reports with more adhoc layouts than are possible with Discoverer, among other benefits.
The first: Discoverer
Discoverer is a BI tool used for adhoc querying, analysis, and reporting of data. It can report against relational as well as Oracle OLAP data sources. It has tens of thousands of customers, and it’s a fine product thank you. You can read more about Discoverer on this blog as well as on OTN.
To begin to cut to the chase, there are two primary enhancements that Discoverer customers have been asking for some time (there are more, but I am picking these two):
1. The limited flexibility when it comes to laying out your Discoverer worksheets. You get a title view, a text area view (basically a title view but at the bottom), a graph, and one table or one pivot table (crosstab). And you can position the graph above, below, to the left, or to the right of the table component.

or

or

or

Now, for adhoc analysis and for many other purposes these layouts are adequate. But sometimes people have felt the need to lay out these views in a more flexible manner.
2. You can schedule a Discoverer worksheet (or worksheets). You can view the results of these scheduled worksheets. You can export a scheduled worksheet. You can email a scheduled worksheet (using Discoverer Viewer). What you cannot do is do all of this in a non-interactive manner. i.e. you cannot tell Discoverer to run a worksheet at a specified date and time, export the results into PDF or XLS, etc..., and then email these results via email to designated people.

The Discoverer Scheduling Manager.

My scheduled Discoverer worksheet in Discoverer Viewer.

This is the scheduled Discoverer worksheet in Viewer.

And this is the email page that I can use to email the scheduled Discoverer worksheet to multiple users, as an attachment (XLS, PDF, HTML, etc...)
The second: BI Publisher (formerly known as XML Publisher) BI Publisher is the enterprise reporting and document creation product from Oracle, and now also part of BI EE. Apart from the millions of uses of BI Publisher, the ones that are pertinent to this post are the ability of BI Publisher to let users create highly formatted reports, schedule them, and have them delivered to a variety of destinations, including email, printer, FTP, WebDAV, etc...
The third: Better Together - what happens when you bring Discoverer and BI Publisher together? No... not a third product, but syncretism! In BI EE 10.1.3.2 BI Publisher was enhanced to let it access Answers based data sources to allow users to create pixel-perfect reports. In BI Publisher 10.1.3.3 this functionality has been logically extended to allow Discoverer data sources – specifically worksheets – to act as data sources to BI Publisher. For this purpose, there were enhancements in both Discoverer and BI Publisher. SOAP web services have been added to Discoverer, for the first time, to expose some functionality of Discoverer that can then be called by programs using these web services. BI Publisher was enhanced to let it recognize and handle Discoverer as a data source.
Therefore, now you can take Discoverer worksheets like this:
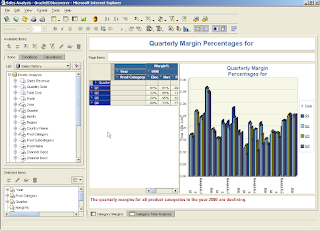
And build nice looking reports like this:
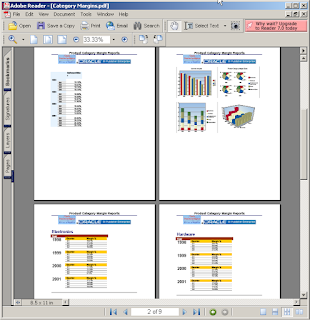
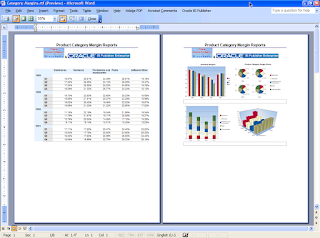
- all using the wonder of BI Publisher.
These reports can also be scheduled to run and have the content distributed to users via email (other supported destinations include FTP, WebDAV, Printer, etc...).
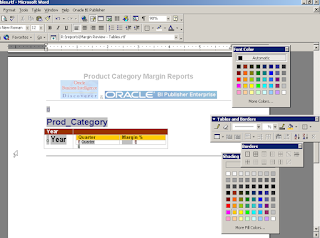
And you can use the BI Publisher Template Builder for Microsoft Word to format and layout these reports:
That's the real quick introduction to Discoverer and BI Publisher integration.
As an aside, I always find it a bit curious and sort-of-interesting when I see a press release or news story describing a new release as having ‘radically improved functionality’, ‘path-breaking’, and simply so great that you have to upgrade. Of course, every release represents improvement over the previous one, or at least it should (otherwise the engineers, product managers, and QA engineers failed to do their jobs and should be fired -sometimes they get promoted, but that’s another story), so in that sense it is reasonable to expect and reasonable to state that the new release is better than the previous one.
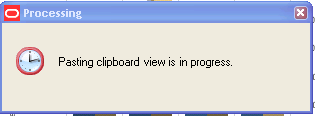
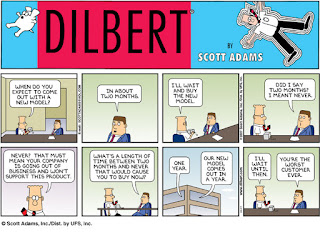
What you really don't want to do is end up in this sort of a situation:
This post attempts to articulate via textual and digital visual aids (aka screenshots) some of the benefits of the loosely coupled integration between BI Publisher and Discoverer that may accrue to users who have a requirement to develop reports with a degree of positional flexibility as it relates to the layout of components usually and typically used for rendering aggregated data in a manner so as to enable and facilitate distribution of the said data thus visualized such that it may be construed to confer functionality greater than that provided by Oracle Discoverer, albeit in a specific context.
Yes – I did that without even using the 'bullshit generator'!
Update: deleted a sentence, and moved the first paragraph from the original post to the bottom.
The first: Discoverer
Discoverer is a BI tool used for adhoc querying, analysis, and reporting of data. It can report against relational as well as Oracle OLAP data sources. It has tens of thousands of customers, and it’s a fine product thank you. You can read more about Discoverer on this blog as well as on OTN.
To begin to cut to the chase, there are two primary enhancements that Discoverer customers have been asking for some time (there are more, but I am picking these two):
1. The limited flexibility when it comes to laying out your Discoverer worksheets. You get a title view, a text area view (basically a title view but at the bottom), a graph, and one table or one pivot table (crosstab). And you can position the graph above, below, to the left, or to the right of the table component.

or

or

or

Now, for adhoc analysis and for many other purposes these layouts are adequate. But sometimes people have felt the need to lay out these views in a more flexible manner.
2. You can schedule a Discoverer worksheet (or worksheets). You can view the results of these scheduled worksheets. You can export a scheduled worksheet. You can email a scheduled worksheet (using Discoverer Viewer). What you cannot do is do all of this in a non-interactive manner. i.e. you cannot tell Discoverer to run a worksheet at a specified date and time, export the results into PDF or XLS, etc..., and then email these results via email to designated people.

The Discoverer Scheduling Manager.

My scheduled Discoverer worksheet in Discoverer Viewer.

This is the scheduled Discoverer worksheet in Viewer.

And this is the email page that I can use to email the scheduled Discoverer worksheet to multiple users, as an attachment (XLS, PDF, HTML, etc...)
The second: BI Publisher (formerly known as XML Publisher) BI Publisher is the enterprise reporting and document creation product from Oracle, and now also part of BI EE. Apart from the millions of uses of BI Publisher, the ones that are pertinent to this post are the ability of BI Publisher to let users create highly formatted reports, schedule them, and have them delivered to a variety of destinations, including email, printer, FTP, WebDAV, etc...
The third: Better Together - what happens when you bring Discoverer and BI Publisher together? No... not a third product, but syncretism! In BI EE 10.1.3.2 BI Publisher was enhanced to let it access Answers based data sources to allow users to create pixel-perfect reports. In BI Publisher 10.1.3.3 this functionality has been logically extended to allow Discoverer data sources – specifically worksheets – to act as data sources to BI Publisher. For this purpose, there were enhancements in both Discoverer and BI Publisher. SOAP web services have been added to Discoverer, for the first time, to expose some functionality of Discoverer that can then be called by programs using these web services. BI Publisher was enhanced to let it recognize and handle Discoverer as a data source.
Therefore, now you can take Discoverer worksheets like this:

And build nice looking reports like this:


- all using the wonder of BI Publisher.
These reports can also be scheduled to run and have the content distributed to users via email (other supported destinations include FTP, WebDAV, Printer, etc...).
And you can use the BI Publisher Template Builder for Microsoft Word to format and layout these reports:

That's the real quick introduction to Discoverer and BI Publisher integration.
As an aside, I always find it a bit curious and sort-of-interesting when I see a press release or news story describing a new release as having ‘radically improved functionality’, ‘path-breaking’, and simply so great that you have to upgrade. Of course, every release represents improvement over the previous one, or at least it should (otherwise the engineers, product managers, and QA engineers failed to do their jobs and should be fired -sometimes they get promoted, but that’s another story), so in that sense it is reasonable to expect and reasonable to state that the new release is better than the previous one.
What you really don't want to do is end up in this sort of a situation:

This post attempts to articulate via textual and digital visual aids (aka screenshots) some of the benefits of the loosely coupled integration between BI Publisher and Discoverer that may accrue to users who have a requirement to develop reports with a degree of positional flexibility as it relates to the layout of components usually and typically used for rendering aggregated data in a manner so as to enable and facilitate distribution of the said data thus visualized such that it may be construed to confer functionality greater than that provided by Oracle Discoverer, albeit in a specific context.
Yes – I did that without even using the 'bullshit generator'!
Update: deleted a sentence, and moved the first paragraph from the original post to the bottom.
Subscribe to:
Posts (Atom)