One of the most common questions I get asked by customers and see on the OTN forums is "Where can I find information on Oracle's Business Intelligence products?", this is closely followed by "what is the difference between product X and product Y and when should I use product X rather than product Y". Given all the acquisitions Oracle has made over the last five years this last question is becoming more and more common.
Getting answers to these non-technical type questions is not as easy as you would imagine.
If you search the web you will find there is a huge amount of technical information available relating to using Oracle's products. I suspect most people start with OTN and then branch out to the various blogs such as this one. The problem for most people is where to get non-technical information. Most of the product home pages provide positioning white papers on their respective OTN home page but this assumes you, as a customer, know what you are looking for. There is a Business Intelligence OTN home page, but this is really a series of links to the various product home pages and does not really add much value. To date it has not been an easy way to get a good overview of the whole data warehouse and BI portfolio. Until now….
Last month I quickly reviewed a newly released book called "Oracle Data Warehousing and Business Intelligence Solutions". The book has been written by three people (two from Oracle) who have a huge amount of experience in positioning data warehouse and BI solutions from a business as well as a technical perspective. It covers all areas of Oracle’s extensive data warehouse and business intelligence product portfolio.
The booked is aimed primarily at IT professionals (DBAs, project managers, business analysts, architects etc) but it goes beyond the various products and provides information on choosing a platform, managing the data warehouse, best practices, how to justify projects and claiming success. Most importantly it covers both BI as it applies to an Oracle Application environment as well as bespoke data warehouse platforms. In fact this book covers the whole project life cycle explaining which products to use at each stage. This is really where the book scores - it provides an excellent insight into the whole project life cycle and lists out the various product offerings within Oracle’s extensive portfolio.
Interestingly the topics covered also include managing the data warehouse. Typically, I find general documentation and general collateral in this area to be far too technical and largely confusing. In contrast this book reviews how products like Enterprise Manager can be used to manage a whole series of data warehouse related tasks. This is not an A to Z of Enterprise Manager functionality but focuses more on the types of issues facing many data warehouse projects and how Enterprise Manager provides the tools to help manage and resolve these issues. It provides and excellent grounding for the most important topics.
Personally, I found the book very useful and would recommend it to people who are both new and experienced in delivering data warehouse and business intelligence projects. Specifically, for anyone about to start a new DW/BI project I would suggest reading the last section of the book that provides and excellent approach for ensuring success with DW/BI projects.
The heading on the book states "Timely, practical, reliable". It most definitely is, and it will help answer a lot of non-technical questions that get posted on OTN. There are more details contained in the original blog posting:
http://oraclebi.blogspot.com/2007/02/new-book-oracle-data-warehousing-and.html
So is there anything missing? Well, there are some recent products that are not covered, such as ODI and obviously there is no information on Hyperion. As there are so many products to cover, the focus is on understanding the key features. Technically orientated people may find the book does not provide enough detail, but I think the real aim of this book (in my opinion) is to provide the reader with enough information to understand the various product offerings, how they fit together and allow them take that knowledge and move on to more effectively use the huge resource available within OTN.
Monday, May 21, 2007
Sunday, May 13, 2007
There never is too much email space

Very, very soon I shall have to spend an hour or two sifting through and deleting several hundred emails... I dread that task - one that I cannot being productive in any meaningful sort of way, except of course if it instills a discipline to be more indiscriminate in deleting emails as they arrive.
Wednesday, May 02, 2007
Oracle Develop Conference
The Oracle Develop Conference is coming to
Seoul (May 14-15), Bangalore (May 17-18), Beijing (May 22-23), Munich (June 18-19), Prague (June 21-22), and London (June 26-27). You can get more details at the OTN site at http://www.oracle.com/technology/events/develop2007/index.html
There are four tracks - "Database Application Development", "Enterprise Java, "SOA—Service-Oriented Architectures", and on ".NET Development".
There is no track or session for business intelligence, in case you were wondering. The target audience is primarily developers, so while I would argue that there are enough 'developer' oriented activities in BI - modeling, ETL, constructing the semantic layer, data warehouse activities including partitioning, indexing considerations, materialized view construction to get efficient query rewrites, and more - there are no BI related tracks or sessions for this year's Develop conference. I am sure we shall have some next year.
The detailed agenda is available at http://www.oracle.com/technology/events/develop2007/schedule-apac.html
Thursday, April 26, 2007
Blog hits
Even though the regularity and frequencey of my blog posts to the BI blog has been a tad irregular, the hits coming to the blog on the other hand has shown a steady increase this year.

Now I need to figure out how to extend this to work and pay... Of course there are many who have it all figured out.

Now I need to figure out how to extend this to work and pay... Of course there are many who have it all figured out.
OTN Forum for BI Enterprise Edition
Check this out - a little over a month old, the OTN Forum for BI Suite Enterprise Edition.
It is available under the Data Warehousing and Business Intelligence category.
It is available under the Data Warehousing and Business Intelligence category.
Almost reads like a delayed April Fools joke
How not to ask a question... - Tom Kyte has this post which links to an OTN Forum post on the SQL and PL/SQL forum. Browse this link when you have free time... Thread: URGENT URGENT PLZ READ B4 OTHERS VERY URGENT NO TIME WASTERS
Wednesday, April 25, 2007
New Office Add-in in 10.1.3.3
I don't think I can quite yet start talking, showing, and in general get excited about the new BI Office Add-in the upcoming BI 10.1.3.3 release quite yet, at least on the blog, but Mark Rittman (Rittman Mead Consulting) has a post (Collaborate’07 Day 2 - BI Roadmap Update) where he mentions Matt Elumba talking about the upcoming BI 10.1.3.3 release that has a new Office Add-in. Yes - a brand new Excel and PowerPoint Add-in with some really, really nice functionality that I am confident shall make every single BI customer to use this add-in. I have confidence in confidence. Or... to use this spiffy new feature of Blogger (How do I use the transliteration feature?) - मन में है विशवास। हम होंगे कामयाब एक दिन.
And of course, there is the integration of Discoverer with BI Publisher - pixel perfect reporting, here I come!
And of course, there is the integration of Discoverer with BI Publisher - pixel perfect reporting, here I come!
Discoverer certified with Apps 11i on Linux
Specifically, if you read Steven Chan's blog post - OracleAS 10g 10.1.2.2 Certified with Apps 11i - it makes things clear, and I quote:
Just to ensure that there's no confusion about what's been certified, the full name of this patchset is:
Just to ensure that there's no confusion about what's been certified, the full name of this patchset is:
* Oracle Application Server and Oracle Developer Suite 10g Release 2 (10.1.2) Patch Set 2 (10.1.2.2.0) (Patch 4960210)
This latest certification includes the use of the following Oracle Application Server 10g components with Apps 11i:
* Discoverer 10g
* Portal 10g
* Web Cache 10g
Just for Linux... For Now
Tuesday, April 24, 2007
BI EE 10.1.3.2.1 is now available
Oracle BI Suite Enterprise Edition 10gR3, version 10.1.3.2.1 (yep - 5 digits in all... say that fast without biting your tongue) is now available for download from OTN.
What's new there? In brief:
- Support for HP UX, Solaris, and IBM AIX, both 32 and 64 bit versions.
- Certification for the Sun Java System Web Server, IBM Tivoli, & CA eTrust Siteminder SSO Servers.
- Support for other of identity management products including Novell Identity Manager, IBM Tivoli Identity Management
Download from Oracle Business Intelligence (10.1.3.x) Downloads
Get the doc from Oracle Business Intelligence Enterprise Edition Documentation
Friday, March 23, 2007
News Story: Q3 Results Show BI EE Key Growth Area for Oracle Earnings
Oracle has just released its Q3 earnings and the results are extremely positive and have been well received by the analyst community.
One of the most important growth areas was business intelligence where many customers are seeing the benefits of Oracle's new pervasive approach to business intelligence. This sales success follows strong support from numerous research firms for Oracle's FMW based BI solutions. Gartner's latest magic quadrants for business intelligence and data warehousing position Oracle in the leaders quadrant.
As part of the formal earnings press release Oracle provided details of key customer wins achieved during this fiscal year. All these customers have chosen to install Oracle Business Intelligence Suite EE to provide their business communities with the ability extract intelligence from applications and data sources and distribute it throughout their company to help optimize business processes, decisions, and actions.
The roll call of companies is quite impressive and includes some very impressive names, such as BMW Group Australia, Chartered Institute of Management Accountants, Indian Tobacco Company, Moet, Morgan Stanley, Nanjing Social Insurance, Rabobank Mobiel, Subaru and many more. A complete full article can be viewed by clicking on this link below which contains the complete list of new BI EE customers:
http://www.decideo.com/Organizations-Choose-Oracle-r-Business-Intelligence-Suite-Enterprise-Edition_a1600.html
Sunday, February 25, 2007
New Book : Java Data Mining: Strategy, Standard, and Practice: A Practical Guide for architecture, design, and implementation
Java Data Mining: Strategy, Standard, and Practice: A Practical Guide for architecture, design, and implementation
By Mark F. Hornick, Erik Marcadé, Sunil Venkayala
Seems as if books on BI are just like buses. You wait ages for one and then two turn up together. While your on Amazon ordering your copy the Oracle Data Warehousing (see the posting last week) you could also order Mark Hornick’s latest book on Java Data Mining. As you can see from the heading Mark has worked with other key data mining experts to provide a great introduction to not only java data mining but data mining in general.
Both Mark and Sunil work for Oracle in the Server Technologies group and Erik is the founder and current CTO of KXEN. All the authors are well known within the data mining community.

Unfortunately it is not possible to use the usual Amazon feature of looking inside the book online. However, a review on the Amazon.co.uk site indicates this book has excellent content (interestingly, the Amazon.co.uk and Amazon.com sites have different reviews of this book. Personally, I find the amazon.co.uk site more useful) . A quick extract from the Amazon.co.uk site:
“Whether you are a software developer, systems architect, data analyst, or business analyst, if you want to take advantage of data mining in the development of advanced analytic applications, Java Data Mining, JDM, the new standard now implemented in core DBMSs and data mining/analysis software, is a key solution component. And this book is the essential guide to the usage of the JDM standard interface. The reference that will help you produce applications with advanced analytics and predictive analytic capabilities. The first and authoritative guide to JDM, written by contributors to the JDM standard”
I have posted a few entries on using data mining in conjunction with multi-dimensional models so I am keen to get started with this book as quickly as possible. As a result, I added this to my list of books that were ordered over weekend from Amazon, along with the Oracle Data Warehousing book. Now I am just waiting for a huge parcel to arrive. I am sure both these books are going to contain a lot of useful information that will find its way on to these pages in one form or another.
You can view the book online using the following link to Amazon.com by clicking here.
And don't forget the Oracle Data Mining blog by Marcos Campos, which can be viewed here
Thursday, February 22, 2007
New Book : Oracle Data Warehousing and Business Intelligence Solutions
Oracle Data Warehousing and Business Intelligence Solutions
by Robert Stackowiak, Joe Rayman, Rick Greenwald
Amazon have just made available an interesting new book on Oracle data warehousing and business intelligence. Three very senior people within the BI community have written it:

Information about the book is limited at the moment. There is a brief synopsis on the Amazon UK website, however, the content looks very promising. Based on the synopsis it would appear the book provides content that is designed to demonstrate how to design and build a data warehouse and then use Oracle's business intelligence tools to analyze data. Information is provided on best practices for using business intelligence tools to mine a data warehouse. It covers all the usual Oracle BI and data warehouse tools:
Fortunately it is possible to use the usual Amazon feature of looking inside the book online, but very strangely this feature only available on the US based Amazon.com and is not available via the Amazon UK website. However, the US website does not show a synopsis of the book, which is available on the UK site.
I have already ordered my copy of the book and will post a formal review in a while. It will be interesting to see how this compares to other books on the subject. I suppose the key question is: Can you ever have enough books on data warehousing? Personally, I don't think so but as I have over 1000 cookery books I may not be the best person to ask!
You can view the book online using the following link:
http://www.amazon.com/gp/reader/0471919217/ref=sib_dp_pt/002-0950533-7827209#reader-link
by Robert Stackowiak, Joe Rayman, Rick Greenwald
Amazon have just made available an interesting new book on Oracle data warehousing and business intelligence. Three very senior people within the BI community have written it:
- Robert Stackowiak, Vice President, Business Intelligence, Oracle Corporation
- Joe Rayman, Consulting VP - BI/Analytics, Oracle Corporation
- Rick Greenwald, author of numerous books on Oracle technology

Information about the book is limited at the moment. There is a brief synopsis on the Amazon UK website, however, the content looks very promising. Based on the synopsis it would appear the book provides content that is designed to demonstrate how to design and build a data warehouse and then use Oracle's business intelligence tools to analyze data. Information is provided on best practices for using business intelligence tools to mine a data warehouse. It covers all the usual Oracle BI and data warehouse tools:
- Warehouse Builder
- JDeveloper & BI Beans
- BI/XML Publisher
- Reports
- BI EE
- Discoverer
- OLAP Spreadsheet Addin for MS Excel
- Portal
- Data Miner
- Enterprise Manager
Fortunately it is possible to use the usual Amazon feature of looking inside the book online, but very strangely this feature only available on the US based Amazon.com and is not available via the Amazon UK website. However, the US website does not show a synopsis of the book, which is available on the UK site.
I have already ordered my copy of the book and will post a formal review in a while. It will be interesting to see how this compares to other books on the subject. I suppose the key question is: Can you ever have enough books on data warehousing? Personally, I don't think so but as I have over 1000 cookery books I may not be the best person to ask!
You can view the book online using the following link:
http://www.amazon.com/gp/reader/0471919217/ref=sib_dp_pt/002-0950533-7827209#reader-link
Wednesday, February 21, 2007
SQL Access to OLAP Cubes
SQL Access to Cubes
Many people have asked: is possible to use normal SQL to access a multi-dimensional cube and associated dimensions? The answer is yes. What this means is that customers using BI EE, BI Publisher, SQL Developer and any other SQL reporting tool can access a 10g R2 OLAP multi-dimensional cube. However, a small warning -
If you plan to use SQL access with an end-user query tool, that tool needs to be able to support embedded total objects.
The SQL access to an OLAP cube returns all the required data points already precomputed so there is no need to issue an aggregation function (for example SUM()) with a GROUP BY command as the aggregation is managed internally within the cube itself. Using SQL Developer most DBAs can probably work around this feature by manually writing the query themselves. But for business users the tool is supposed to do all the work for them so it needs to be “embedded total” aware. Fortunately, BI EE can support this type of data source, so BI EE customers can combine Oracle 10g OLAP data with data from their other non-olap data sources quickly and easily.
(Unfortunately, Discoverer does not at the moment support embedded total objects so integrating SQL access to OLAP into the EUL is currently not possible).
How do you SQL enable an OLAP cube?
For this example I will use the common schema sample shipped with BI 10g (SH_OLAP schema) which contains a dimension called PRODUCTS that has the following structure:
To query the PRODUCTS dimension using SQL you have to create a view, which would look something like this:
PRODUCTS VARCHAR2(4000) WEIGHT_CLASS VARCHAR2(4000) PACK_SIZE VARCHAR2(4000) PRODUCTS_SDSC VARCHAR2(4000) PRODUCTS_LDSC VARCHAR2(4000) PRODUCTS_PRODUCT_LVLDSC VARCHAR2(4000) PRODUCTS_SUBCATEGOR_LVLDSC VARCHAR2(4000) PRODUCTS_CATEGORY_LVLDSC VARCHAR2(4000) PRODUCTS_PROD_TOP_LVLDSC VARCHAR2(4000) PRODUCTS_STANDARD_PRNT VARCHAR2(4000) PRODUCTS_LEVEL VARCHAR2(4000) PRODUCT_ID VARCHAR2(4000) SUPPLIER_ID VARCHAR2(4000) UNIT_OF_MEASURE VARCHAR2(4000)
The SQL query used to provide the data needs to be defined as follows:
CREATE OR REPLACE FORCE VIEW "SH_OLAP"."PRODUCTS_DIMVIEW" (
"PRODUCTS"
, "PRODUCTS_LEVEL"
, "PRODUCT_ID"
, "SUPPLIER_ID"
, "UNIT_OF_MEASURE"
, "WEIGHT_CLASS"
, "PACK_SIZE"
, "PRODUCTS_SDSC"
, "PRODUCTS_LDSC"
, "PRODUCTS_PRODUCT_LVLDSC"
, "PRODUCTS_SUBCATEGOR_LVLDSC"
, "PRODUCTS_CATEGORY_LVLDSC"
, "PRODUCTS_PROD_TOP_LVLDSC"
, "PRODUCTS_STANDARD_PRNT")
AS SELECT "PRODUCTS"
,"PRODUCTS_LEVEL"
,"PRODUCT_ID"
,"SUPPLIER_ID"
,"UNIT_OF_MEASURE"
,"WEIGHT_CLASS"
,"PACK_SIZE"
,"PRODUCTS_SDSC"
,"PRODUCTS_LDSC"
,"PRODUCTS_PRODUCT_LVLDSC"
,"PRODUCTS_SUBCATEGOR_LVLDSC"
,"PRODUCTS_CATEGORY_LVLDSC"
,"PRODUCTS_PROD_TOP_LVLDSC"
,"PRODUCTS_STANDARD_PRNT"
FROM table(OLAP_TABLE ('SH_OLAP.SH_AW duration session', '', '', '&(PRODUCTS_LIMITMAP)'))
MODEL DIMENSION BY ( PRODUCTS) MEASURES
( PRODUCTS_LEVEL
, PRODUCT_ID
, SUPPLIER_ID
, UNIT_OF_MEASURE
, WEIGHT_CLASS, PACK_SIZE
, PRODUCTS_SDSC
, PRODUCTS_LDSC
, PRODUCTS_PRODUCT_LVLDSC
, PRODUCTS_SUBCATEGOR_LVLDSC
, PRODUCTS_CATEGORY_LVLDSC
, PRODUCTS_PROD_TOP_LVLDSC
, PRODUCTS_STANDARD_PRNT )
RULES UPDATE SEQUENTIAL ORDER();
Now the view looks reasonably straightforward until you get about half through the code and notice the use of an OLAP_TABLE() function. This function returns a normal two-dimensional relational table structure from the source multi-dimensional object. The function has a number of inputs one of which is a call to a LIMIT_MAP. The OLAP_TABLE uses a limit map to map dimensions and measures defined in an analytic workspace to columns in a logical table. The limit map combines with the WHERE clause of a SQL SELECT statement to generate a series of OLAP DML LIMIT commands that are executed in the analytic workspace.
Oracle OLAP Reference Manual 10g Release 2 provides more details on the OLAP_TABLE() function.
In this example the limit map is called PRODUCTS_LIMITMAP and is stored within the analytic workspace and it looks like this:
DIMENSION PRODUCTS FROM PRODUCTS WITH
HIERARCHY PRODUCTS_STANDARD_PRNT FROM
PRODUCTS_PARENTREL(PRODUCTS_HIERLIST 'STANDARD')
INHIERARCHY PRODUCTS_INHIER FAMILYREL
PRODUCTS_PROD_TOP_LVLDSC
, PRODUCTS_CATEGORY_LVLDSC
, PRODUCTS_SUBCATEGOR_LVLDSC
, PRODUCTS_PRODUCT_LVLDSC
FROM PRODUCTS_FAMILYREL(PRODUCTS_LEVELLIST 'PROD_TOP')
, PRODUCTS_FAMILYREL(PRODUCTS_LEVELLIST 'CATEGORY')
, PRODUCTS_FAMILYREL(PRODUCTS_LEVELLIST 'SUBCATEGORY')
, PRODUCTS_FAMILYREL(PRODUCTS_LEVELLIST 'PRODUCT')
LABEL PRODUCTS_LONG_DESCRIPTION
ATTRIBUTE UNIT_OF_MEASURE FROM PRODUCTS_UNIT_OF_MEASURE
ATTRIBUTE SUPPLIER_ID FROM PRODUCTS_SUPPLIER_ID
ATTRIBUTE PRODUCT_ID FROM PRODUCTS_PRODUCT_ID
ATTRIBUTE PRODUCTS_LEVEL FROM PRODUCTS_LEVELREL
ATTRIBUTE PRODUCTS_LDSC FROM PRODUCTS_LONG_DESCRIPTION
ATTRIBUTE PRODUCTS_SDSC FROM PRODUCTS_SHORT_DESCRIPTION
ATTRIBUTE PACK_SIZE FROM PRODUCTS_PACK_SIZE
ATTRIBUTE WEIGHT_CLASS FROM PRODUCTS_WEIGHT_CLASS
It maps the AW objects to the columns referenced within the view. Having the limit map defined within the AW as a text variable makes it easier to modify the data that can be returned into the view by the analytic workspace.
The same techniques can be used to create a view to return data form a cube. Making a view over the sales cube, which contains 35 measures and attributes relating to 4 dimensions (Time, Channel, Geography, Products), would look something like this:
TIME VARCHAR2(4000)
CHANNELS VARCHAR2(4000)
GEOGRAPHIES VARCHAR2(4000)
PRODUCTS VARCHAR2(4000)
TIME_LEVEL VARCHAR2(4000)
TIME_LDSC VARCHAR2(4000)
TIME_CAL_MONTH_LVLDSC VARCHAR2(4000)
TIME_CAL_QTR_LVLDSC VARCHAR2(4000)
TIME_CAL_YEAR_LVLDSC VARCHAR2(4000)
TIME_CALENDAR_PRNT VARCHAR2(4000)
CHANNELS_LEVEL VARCHAR2(4000)
CHANNELS_LDSC VARCHAR2(4000)
CHANNELS_CHANNEL_LVLDSC VARCHAR2(4000)
CHANNELS_CLASS_LVLDSC VARCHAR2(4000)
CHANNELS_TOP_LVLDSC VARCHAR2(4000)
CHANNELS_STANDARD_PRNT VARCHAR2(4000)
GEOGRAPHIE_LEVEL VARCHAR2(4000)
GEOGRAPHIE_LDSC VARCHAR2(4000)
GEOGRAPHIE_COUNTRY_LVLDSC VARCHAR2(4000)
GEOGRAPHIE_SUBREGION_LVLDSC VARCHAR2(4000)
GEOGRAPHIE_REGION_LVLDSC VARCHAR2(4000)
GEOGRAPHIE_WORLD_LVLDSC VARCHAR2(4000)
GEOGRAPHIE_STANDARD_PRNT VARCHAR2(4000)
PRODUCTS_LDSC VARCHAR2(4000)
PRODUCTS_PROD_TOP_LVLDSC VARCHAR2(4000)
PRODUCTS_STANDARD_PRNT VARCHAR2(4000)
PRODUCTS_LEVEL VARCHAR2(4000)
PRODUCT_ID VARCHAR2(4000)
PRODUCTS_PRODUCT_LVLDSC VARCHAR2(4000)
PRODUCTS_SUBCATEGOR_LVLDSC VARCHAR2(4000)
PRODUCTS_CATEGORY_LVLDSC VARCHAR2(4000)
REVENUE BINARY_DOUBLE
SR_MA_12M BINARY_DOUBLE
SR_MA_6M BINARY_DOUBLE
SR_PC_PP BINARY_DOUBLE
SR_PC_YA BINARY_DOUBLE
GEOGRAPHY_SHARE_PARENT NUMBER
GEOGRAPHY_SHARE_TOTAL BINARY_DOUBLE
PRODUCT_SHARE_PARENT NUMBER
PRODUCT_SHARE_TOTAL BINARY_DOUBLE
CHANNEL_SHARE_TOTAL BINARY_DOUBLE
CHANNEL_SHARE_PARENT NUMBER
With a view over the cube it is now possible to select values from the cube from any level without having to issue an aggregation function or worry about using a GROUP BY command. For example, to create a report that shows the revenue, 12 month moving average, 6 month moving average, % growth from prior period, % growth from prior year for 1999, 2000 and 2001, for products at the Category level, for all channels and for all geographies the query could be written as follows:
COLUMN TIME_LDSC FORMAT A7
COLUMN PRODUCTS_LDSC FORMAT A35
COLUMN REVENUE FORMAT 999,999,999.99
COLUMN SR_MA_12M FORMAT 999,999,999.99
COLUMN SR_MA_6M FORMAT 999,999,999.99
COLUMN SR_PC_PP FORMAT 99.99 COLUMN
SR_PC_YA FORMAT 99.99
break on PRODUCTS_LDSC skip 1
select PRODUCTS_LDSC
, TIME_LDSC , REVENUE
, SR_MA_12M
, SR_MA_6M
, SR_PC_PP
, SR_PC_YA
from SALES_CUBEVIEW
where GEOGRAPHIE_LEVEL = 'WORLD'
AND TIME IN ('1803', '1804', '1805')
AND CHANNELS IN ('1')
AND PRODUCTS_LEVEL = 'CATEGORY'
ORDER BY PRODUCTS_LDSC , TIME_LDSC;
CLEAR COLUMN
The process for creating these special SQL views is now very simple thanks to a new plug-in for Analytic Workspace Manager. This has been created by OLAP product management team (Marty Gubar) and is an example of how to extend AWM using the new extensibility interface. Once you have downloaded and installed the addin you create your OLAP schema in the normal way. It is possible to create a relational view over both dimensions and cubes with the process being the same for both objects. Once you have loaded data into your analytic workspace right-mouse click on a dimension or cube and the “Create Relational View…” option should be visible at the bottom of the menu:

The first step of the wizard allows you to select the attributes and measures to make visible via the view. Be warned, you may have to deselect some attributes and/or measures to make this work. The reason being there is a SQL limit (4000 characters I think) within the process of defining a view, therefore, you may have to deselect some measures and/or attributes to successfully create the view. Unfortunately, no error message is displayed if things go wrong during the definition, however, when you try to select from the SQL view you may get an error message saying the LIMIT MAP does not exist. This implies you selected too many columns.

I am sure this issue will be resolved in a later build. For the moment it is not a major issue and the problem is quickly and easily resolved. Expand each node in the tree and deselect items that are not actually required:

Ideally when thinking about which views to create and the contents of those views you want to try and create views that minimize the need to use joins to create a result within the reporting tool such as BI EE. Therefore, it may be necessary to do some research first to determine which measures and attributes users actually need to allow them to create their reports. In other words do not try and expose every single attribute and measure.
This new addin to Analytic Workspace Manager (thanks to Marty Gubar) makes it very easy for BI EE customers to include data contained within a 10g OLAP cube as part of a BI EE report.
Useful Links
Analytic Workspace Manager
http://www.oracle.com/technology/software/htdocs/devlic.html?=http://download.oracle.com/otn/java/olap/AWM102030_Win.zip
Relational View Generator software
http://www.oracle.com/technology/products/bi/olap/viewGenerator_1_0.zip
Documentation: http://www.oracle.com/technology/products/bi/olap/ViewGenerator.html
Many people have asked: is possible to use normal SQL to access a multi-dimensional cube and associated dimensions? The answer is yes. What this means is that customers using BI EE, BI Publisher, SQL Developer and any other SQL reporting tool can access a 10g R2 OLAP multi-dimensional cube. However, a small warning -
If you plan to use SQL access with an end-user query tool, that tool needs to be able to support embedded total objects.
The SQL access to an OLAP cube returns all the required data points already precomputed so there is no need to issue an aggregation function (for example SUM()) with a GROUP BY command as the aggregation is managed internally within the cube itself. Using SQL Developer most DBAs can probably work around this feature by manually writing the query themselves. But for business users the tool is supposed to do all the work for them so it needs to be “embedded total” aware. Fortunately, BI EE can support this type of data source, so BI EE customers can combine Oracle 10g OLAP data with data from their other non-olap data sources quickly and easily.
(Unfortunately, Discoverer does not at the moment support embedded total objects so integrating SQL access to OLAP into the EUL is currently not possible).
How do you SQL enable an OLAP cube?
For this example I will use the common schema sample shipped with BI 10g (SH_OLAP schema) which contains a dimension called PRODUCTS that has the following structure:
- Levels:
- All Products
- Categories
- SubCategories
- Products
- Attributes
- Long Description
- Short Description
- Level Description
- Supplier ID
- Unit of Measure
- Weight Class
- Pack size
To query the PRODUCTS dimension using SQL you have to create a view, which would look something like this:
PRODUCTS VARCHAR2(4000) WEIGHT_CLASS VARCHAR2(4000) PACK_SIZE VARCHAR2(4000) PRODUCTS_SDSC VARCHAR2(4000) PRODUCTS_LDSC VARCHAR2(4000) PRODUCTS_PRODUCT_LVLDSC VARCHAR2(4000) PRODUCTS_SUBCATEGOR_LVLDSC VARCHAR2(4000) PRODUCTS_CATEGORY_LVLDSC VARCHAR2(4000) PRODUCTS_PROD_TOP_LVLDSC VARCHAR2(4000) PRODUCTS_STANDARD_PRNT VARCHAR2(4000) PRODUCTS_LEVEL VARCHAR2(4000) PRODUCT_ID VARCHAR2(4000) SUPPLIER_ID VARCHAR2(4000) UNIT_OF_MEASURE VARCHAR2(4000)
The SQL query used to provide the data needs to be defined as follows:
CREATE OR REPLACE FORCE VIEW "SH_OLAP"."PRODUCTS_DIMVIEW" (
"PRODUCTS"
, "PRODUCTS_LEVEL"
, "PRODUCT_ID"
, "SUPPLIER_ID"
, "UNIT_OF_MEASURE"
, "WEIGHT_CLASS"
, "PACK_SIZE"
, "PRODUCTS_SDSC"
, "PRODUCTS_LDSC"
, "PRODUCTS_PRODUCT_LVLDSC"
, "PRODUCTS_SUBCATEGOR_LVLDSC"
, "PRODUCTS_CATEGORY_LVLDSC"
, "PRODUCTS_PROD_TOP_LVLDSC"
, "PRODUCTS_STANDARD_PRNT")
AS SELECT "PRODUCTS"
,"PRODUCTS_LEVEL"
,"PRODUCT_ID"
,"SUPPLIER_ID"
,"UNIT_OF_MEASURE"
,"WEIGHT_CLASS"
,"PACK_SIZE"
,"PRODUCTS_SDSC"
,"PRODUCTS_LDSC"
,"PRODUCTS_PRODUCT_LVLDSC"
,"PRODUCTS_SUBCATEGOR_LVLDSC"
,"PRODUCTS_CATEGORY_LVLDSC"
,"PRODUCTS_PROD_TOP_LVLDSC"
,"PRODUCTS_STANDARD_PRNT"
FROM table(OLAP_TABLE ('SH_OLAP.SH_AW duration session', '', '', '&(PRODUCTS_LIMITMAP)'))
MODEL DIMENSION BY ( PRODUCTS) MEASURES
( PRODUCTS_LEVEL
, PRODUCT_ID
, SUPPLIER_ID
, UNIT_OF_MEASURE
, WEIGHT_CLASS, PACK_SIZE
, PRODUCTS_SDSC
, PRODUCTS_LDSC
, PRODUCTS_PRODUCT_LVLDSC
, PRODUCTS_SUBCATEGOR_LVLDSC
, PRODUCTS_CATEGORY_LVLDSC
, PRODUCTS_PROD_TOP_LVLDSC
, PRODUCTS_STANDARD_PRNT )
RULES UPDATE SEQUENTIAL ORDER();
Now the view looks reasonably straightforward until you get about half through the code and notice the use of an OLAP_TABLE() function. This function returns a normal two-dimensional relational table structure from the source multi-dimensional object. The function has a number of inputs one of which is a call to a LIMIT_MAP. The OLAP_TABLE uses a limit map to map dimensions and measures defined in an analytic workspace to columns in a logical table. The limit map combines with the WHERE clause of a SQL SELECT statement to generate a series of OLAP DML LIMIT commands that are executed in the analytic workspace.
Oracle OLAP Reference Manual 10g Release 2 provides more details on the OLAP_TABLE() function.
In this example the limit map is called PRODUCTS_LIMITMAP and is stored within the analytic workspace and it looks like this:
DIMENSION PRODUCTS FROM PRODUCTS WITH
HIERARCHY PRODUCTS_STANDARD_PRNT FROM
PRODUCTS_PARENTREL(PRODUCTS_HIERLIST 'STANDARD')
INHIERARCHY PRODUCTS_INHIER FAMILYREL
PRODUCTS_PROD_TOP_LVLDSC
, PRODUCTS_CATEGORY_LVLDSC
, PRODUCTS_SUBCATEGOR_LVLDSC
, PRODUCTS_PRODUCT_LVLDSC
FROM PRODUCTS_FAMILYREL(PRODUCTS_LEVELLIST 'PROD_TOP')
, PRODUCTS_FAMILYREL(PRODUCTS_LEVELLIST 'CATEGORY')
, PRODUCTS_FAMILYREL(PRODUCTS_LEVELLIST 'SUBCATEGORY')
, PRODUCTS_FAMILYREL(PRODUCTS_LEVELLIST 'PRODUCT')
LABEL PRODUCTS_LONG_DESCRIPTION
ATTRIBUTE UNIT_OF_MEASURE FROM PRODUCTS_UNIT_OF_MEASURE
ATTRIBUTE SUPPLIER_ID FROM PRODUCTS_SUPPLIER_ID
ATTRIBUTE PRODUCT_ID FROM PRODUCTS_PRODUCT_ID
ATTRIBUTE PRODUCTS_LEVEL FROM PRODUCTS_LEVELREL
ATTRIBUTE PRODUCTS_LDSC FROM PRODUCTS_LONG_DESCRIPTION
ATTRIBUTE PRODUCTS_SDSC FROM PRODUCTS_SHORT_DESCRIPTION
ATTRIBUTE PACK_SIZE FROM PRODUCTS_PACK_SIZE
ATTRIBUTE WEIGHT_CLASS FROM PRODUCTS_WEIGHT_CLASS
It maps the AW objects to the columns referenced within the view. Having the limit map defined within the AW as a text variable makes it easier to modify the data that can be returned into the view by the analytic workspace.
The same techniques can be used to create a view to return data form a cube. Making a view over the sales cube, which contains 35 measures and attributes relating to 4 dimensions (Time, Channel, Geography, Products), would look something like this:
TIME VARCHAR2(4000)
CHANNELS VARCHAR2(4000)
GEOGRAPHIES VARCHAR2(4000)
PRODUCTS VARCHAR2(4000)
TIME_LEVEL VARCHAR2(4000)
TIME_LDSC VARCHAR2(4000)
TIME_CAL_MONTH_LVLDSC VARCHAR2(4000)
TIME_CAL_QTR_LVLDSC VARCHAR2(4000)
TIME_CAL_YEAR_LVLDSC VARCHAR2(4000)
TIME_CALENDAR_PRNT VARCHAR2(4000)
CHANNELS_LEVEL VARCHAR2(4000)
CHANNELS_LDSC VARCHAR2(4000)
CHANNELS_CHANNEL_LVLDSC VARCHAR2(4000)
CHANNELS_CLASS_LVLDSC VARCHAR2(4000)
CHANNELS_TOP_LVLDSC VARCHAR2(4000)
CHANNELS_STANDARD_PRNT VARCHAR2(4000)
GEOGRAPHIE_LEVEL VARCHAR2(4000)
GEOGRAPHIE_LDSC VARCHAR2(4000)
GEOGRAPHIE_COUNTRY_LVLDSC VARCHAR2(4000)
GEOGRAPHIE_SUBREGION_LVLDSC VARCHAR2(4000)
GEOGRAPHIE_REGION_LVLDSC VARCHAR2(4000)
GEOGRAPHIE_WORLD_LVLDSC VARCHAR2(4000)
GEOGRAPHIE_STANDARD_PRNT VARCHAR2(4000)
PRODUCTS_LDSC VARCHAR2(4000)
PRODUCTS_PROD_TOP_LVLDSC VARCHAR2(4000)
PRODUCTS_STANDARD_PRNT VARCHAR2(4000)
PRODUCTS_LEVEL VARCHAR2(4000)
PRODUCT_ID VARCHAR2(4000)
PRODUCTS_PRODUCT_LVLDSC VARCHAR2(4000)
PRODUCTS_SUBCATEGOR_LVLDSC VARCHAR2(4000)
PRODUCTS_CATEGORY_LVLDSC VARCHAR2(4000)
REVENUE BINARY_DOUBLE
SR_MA_12M BINARY_DOUBLE
SR_MA_6M BINARY_DOUBLE
SR_PC_PP BINARY_DOUBLE
SR_PC_YA BINARY_DOUBLE
GEOGRAPHY_SHARE_PARENT NUMBER
GEOGRAPHY_SHARE_TOTAL BINARY_DOUBLE
PRODUCT_SHARE_PARENT NUMBER
PRODUCT_SHARE_TOTAL BINARY_DOUBLE
CHANNEL_SHARE_TOTAL BINARY_DOUBLE
CHANNEL_SHARE_PARENT NUMBER
With a view over the cube it is now possible to select values from the cube from any level without having to issue an aggregation function or worry about using a GROUP BY command. For example, to create a report that shows the revenue, 12 month moving average, 6 month moving average, % growth from prior period, % growth from prior year for 1999, 2000 and 2001, for products at the Category level, for all channels and for all geographies the query could be written as follows:
COLUMN TIME_LDSC FORMAT A7
COLUMN PRODUCTS_LDSC FORMAT A35
COLUMN REVENUE FORMAT 999,999,999.99
COLUMN SR_MA_12M FORMAT 999,999,999.99
COLUMN SR_MA_6M FORMAT 999,999,999.99
COLUMN SR_PC_PP FORMAT 99.99 COLUMN
SR_PC_YA FORMAT 99.99
break on PRODUCTS_LDSC skip 1
select PRODUCTS_LDSC
, TIME_LDSC , REVENUE
, SR_MA_12M
, SR_MA_6M
, SR_PC_PP
, SR_PC_YA
from SALES_CUBEVIEW
where GEOGRAPHIE_LEVEL = 'WORLD'
AND TIME IN ('1803', '1804', '1805')
AND CHANNELS IN ('1')
AND PRODUCTS_LEVEL = 'CATEGORY'
ORDER BY PRODUCTS_LDSC , TIME_LDSC;
CLEAR COLUMN
The process for creating these special SQL views is now very simple thanks to a new plug-in for Analytic Workspace Manager. This has been created by OLAP product management team (Marty Gubar) and is an example of how to extend AWM using the new extensibility interface. Once you have downloaded and installed the addin you create your OLAP schema in the normal way. It is possible to create a relational view over both dimensions and cubes with the process being the same for both objects. Once you have loaded data into your analytic workspace right-mouse click on a dimension or cube and the “Create Relational View…” option should be visible at the bottom of the menu:

The first step of the wizard allows you to select the attributes and measures to make visible via the view. Be warned, you may have to deselect some attributes and/or measures to make this work. The reason being there is a SQL limit (4000 characters I think) within the process of defining a view, therefore, you may have to deselect some measures and/or attributes to successfully create the view. Unfortunately, no error message is displayed if things go wrong during the definition, however, when you try to select from the SQL view you may get an error message saying the LIMIT MAP does not exist. This implies you selected too many columns.

I am sure this issue will be resolved in a later build. For the moment it is not a major issue and the problem is quickly and easily resolved. Expand each node in the tree and deselect items that are not actually required:

Ideally when thinking about which views to create and the contents of those views you want to try and create views that minimize the need to use joins to create a result within the reporting tool such as BI EE. Therefore, it may be necessary to do some research first to determine which measures and attributes users actually need to allow them to create their reports. In other words do not try and expose every single attribute and measure.
This new addin to Analytic Workspace Manager (thanks to Marty Gubar) makes it very easy for BI EE customers to include data contained within a 10g OLAP cube as part of a BI EE report.
Useful Links
Analytic Workspace Manager
http://www.oracle.com/technology/software/htdocs/devlic.html?=http://download.oracle.com/otn/java/olap/AWM102030_Win.zip
Relational View Generator software
http://www.oracle.com/technology/products/bi/olap/viewGenerator_1_0.zip
Documentation: http://www.oracle.com/technology/products/bi/olap/ViewGenerator.html
Thursday, February 15, 2007
Using Market Basket Analysis to add value to OLAP
Using Market Basket Analysis to add value to OLAP
Anyone who has an interest in data warehousing and/or business intelligence understands the concepts of dimensions and hierarchies, which are key parts of a multi-dimensional model. In most cases the structure of a hierarchy is driven the corporate business environment. For example, if we consider the common schema (SH) that is shipped with the 10g version of the database, the product dimension has one single hierarchy that is based on normal business levels: Categories, sub-categories and products.
Regular readers of this blog will might remember a posting from last year where I explained how you could use attribute importance to help determine the most important dimensions within a cube. This posting uses another data mining feature to help business users analyse product groupings.
Most people are aware of the concepts of a shopping cart from buying products online, and it can be extremely useful to track the contents of these baskets. Each basket can provide valuable insight into customer buying patterns and provide the opportunity to identify options for cross selling. Therefore, to analyse customer-purchasing behaviour we need to extract the following information
One of the many benefits of Oracle’s 10g database is packed with features and the trick to getting the maximum benefit from the investment in Enterprise Edition is to make these features work together.
In this case we can use an association rules algorithm, part of Oracle Data Mining, to create an alternative product hierarchy that can be used to provide additional insight into business operations.
The association rules (AR) algorithm predicts the probability of co-occurrence among sets of attribute values. The most well-know use case for AR is market basket analysis, which predicts items occurring together in a market checkout session. This type of hierarchy can be used to help identify cross sell opportunities and product bundle strategies as well as product placement within online and the more traditional bricks and mortar stores.
Creating a Market Basket Analysis
Creating the association rules model
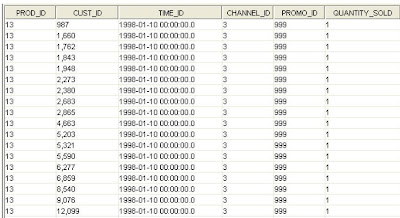
The sources for this example are the tables within the BI10g common schema. The SALES table contains point of sale data, which can be used as the main input to the market basket algorithm. To get started, you will need to have installed the Oracle Data Mining (ODM) Option (the default) during installation of the Oracle Database 10g. This ODM algorithm requires that the data be in this “transactional” format, with one item being represented in each row. This is an efficient representation, as any shopping basket will typically include several items from a possible hundreds or thousands of store items. The alternative, storing the data in a “single record per market basket”, would cause there to be hundreds to thousands of possible store items (attributes) with most of them being blank or null
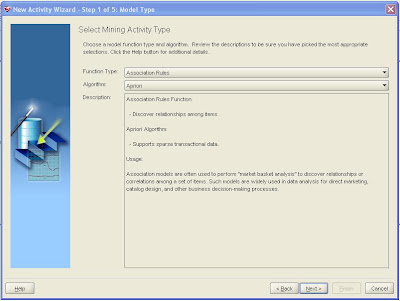
Launch Oracle Data Miner client (for download details see the links at the end of this posting). Select Build from the Activity pull-down menu to launch the activity, and select Association Rules from the Function Type pull-down menu. Click Next.
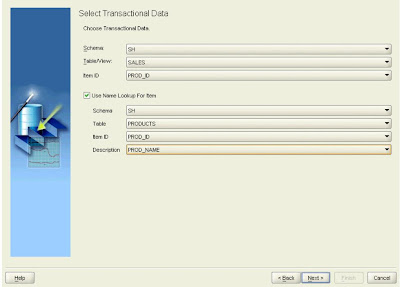
The transactions (market baskets) are contained in the SALES table; select PROD_ID as the identifier for the items purchased. However, the products are identified only by an item code; the names of the products are in the PRODUCTS table, so click the checkbox indicating that there is a Name Lookup table, and select the table, the item identifier (PROD_ID), and the column containing the item description (PROD_NAME). This will then create meaningful product descriptions in the results table that can then used to populate the description for the dimension.
Click Next to continue.
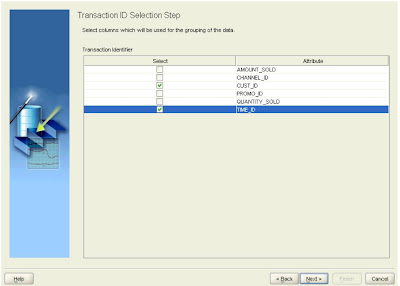
 Two columns are required to identify a single market basket. Click the checkboxes for CUST_ID and TIME_ID, then click Next.
The final step is to enter a name for the activity and click Next. On the final page of the wizard, click Advanced Settings to see the parameters available for Association Rules. In this case the default settings can be used. However, there are a lot of parameters that can used to tune the model. For more information regarding these parameters please refer to the documentation for Oracle Data Mining 10g Release 2. This can be downloaded from OTN.
Click OK to return to the last page of the wizard and click Finish to run the activity. When the activity completes, click Result in the Build step to access the rules defined by the model.
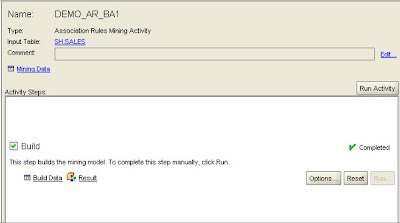
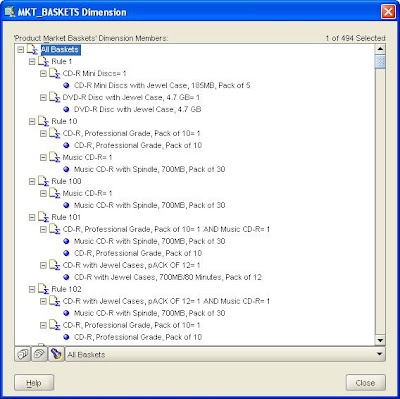
In this example, 115 rules were defined using the default parameter settings based on the transactions listed in the sales table
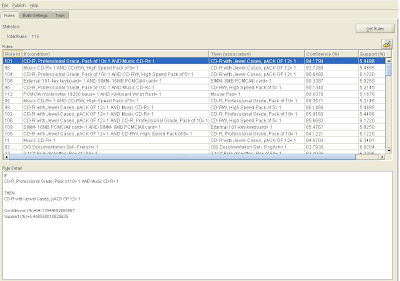
As well as the details of the products that comprise the rule two additional columns are provided: Confidence (%) and Support (%). The Support for the rule is the percentage of baskets containing the items in the rule. In the example, Support is the percentage of all baskets containing the three items mouse, keyboard and printer.
The Confidence for the rule is the percentage of baskets containing the item(s) in the antecedents that also contain the consequent. In the example, consider only baskets containing keyboard and mouse and calculate the percentage of those baskets that contain printers.
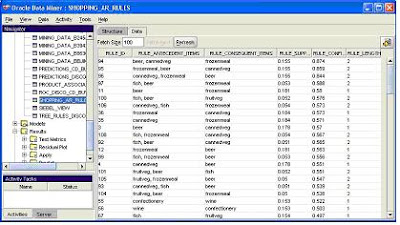
Saving the results
Finally, the results from the model can be published to a table. This table will then form the raw source for the new OLAP product dimension. Notice at this point there is no information relating to revenue, costs or quantity. All that information is already contained in the existing fact table that is used to feed the standard sales revenue, sales costs and sales quantity measures. All that needs to be done is to link the product bundles to the original fact table to extract the revenue, costs and quantity for each product within a bundle. The process for doing this will be explained later.
Designing the product dimension
The results from the algorithm table have to be transformed to provide a correctly formatted source for the dimension mapping. This requires the use of either OLAP DML (for those used to this powerful language) or PL/SQL. The aim is to create a new dimension table that confirms to the normal requirements for a source table. Therefore, a new top level has to be added to provide a total for “All Rules” and columns need to be populated for each of the attributes.
Each rule has to be broken down into its constituent parts:
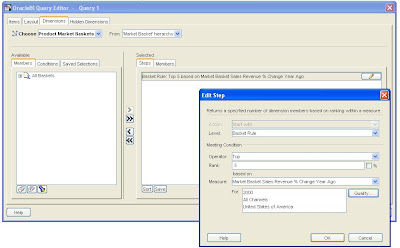
This will allow us to track and analyze product bundles as part of the normal reporting process. Using the attributes associated with each rule, OLAP query steps can be created that further refine the analysis of product bundles by allowing business users to filter the results based on the value for % confidence associated with the rule.
In this example the decision has been taken to create a separate dimension to hold the results from the algorithm. The dimension is based around a single hierarchy with the following levels:
This structure is outlined below with the associated attributes of:
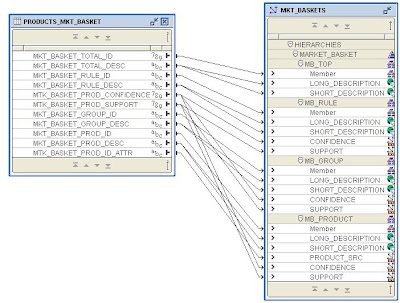
The finished mapping looks like this:
Once the dimension has been maintained you can use the Dimension Viewer to check the results.
Designing the cube
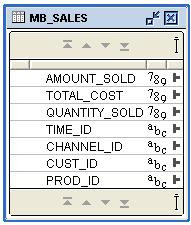
The next requirement is to create a new source table that can be used in the mapping for the cube. Again some coding is required to create this new fact table. The code needs to extract the source products from each rule and identify the associated costs, revenue and quantity from the original fact table. This will then be moved to a new fact table to make mapping and loading data much easier to manager.
The new fact table looks like this:
When the cube is aggregated it will be possible to view the total revenue, total cost, total quantity, margin etc derived from the various products that are part of the rule.
A new cube called “MB” is created and the all the usual dimensions except in this case the new market basket dimension replaces PRODUCT dimension. The definition of the cube follows the same pattern as the other cubes in the sample schema.
In this case the figure for “All Baskets” which is the top level of the new market basket dimension is largely irrelevant. The reason for this is because the same product can appear in multiple rules, therefore, the value for total revenue, or total cost or total quantity is based on double counting of values. So this top value has to be treated with caution.
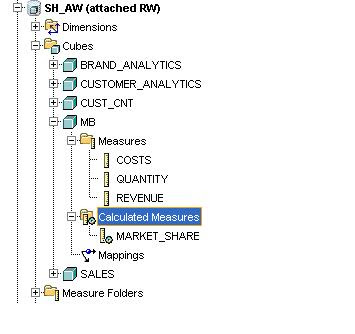 Now it is possible to create all the usual calculated measures for each of the base measures associated with a product bundle (revenue, costs, quantity, and margin) , such as those linked to the other cubes that are part of the common schema sample. For example:
MB_REVENUE/SALES_REVENUE(PRODUCTS '1')*100
All these new measures can finally be added to a new measure folder called Market Basket Analysis and everything is ready for access by Discoverer OLAP, BI Beans and/or Spreadsheet Addin.
So what does this provide? With this cube it will now be possible to answer the following types of questions:
Viewing the Results in Excel
Using Spreadsheet Addin it is now possible to connect to the updated schema. Launching the query builder shows the new dimension (Product Market Baskets) and the associated new measures for the market basket analysis
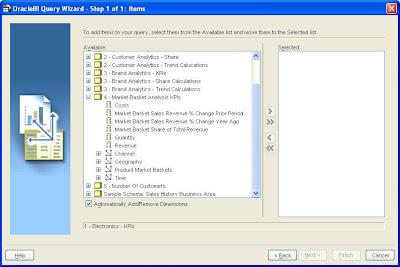
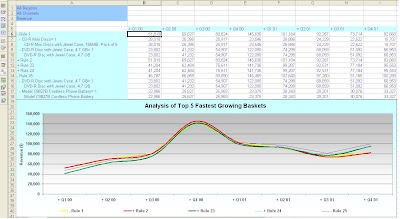
With this new dimension it is now possible to analyze the performance of each basket in the context of % growth prior period, % growth prior year etc. An obvious report to create is to show the performance of the top 5 baskets based on % growth prior year for year 2000, within the USA across All Channels.
The results from this query can be plotted on a line graph to show the revenue trend over the last 8 quarters as shown below.
Links
To help you get started creating your own market basket analysis here are some links that might be useful:
Data Mining
Oracle Data Mining on OTN:
http://www.oracle.com/technology/products/bi/odm/index.html
Oracle Data Miner Client on OTN:
http://www.oracle.com/technology/products/bi/odm/odminer.html
Data Miner Client software:
http://www.oracle.com/technology/software/htdocs/devlic.html?url=http://download.oracle.com/odm/odminer/odminer10203/odminer.zip
Data Miner Client installation instructions:
http://www.oracle.com/technology/products/bi/odm/odminer/odminer_install_10202.htm
Data Miner Tutorial
http://download.oracle.com/odm/odminer/odminer_tutorial_10201.zip
OLAP
Oracle OLAP on OTN:
http://www.oracle.com/technology/products/bi/olap/olap.html
Analytic Workspace Manager software:
http://www.oracle.com/technology/software/htdocs/devlic.html?=http://download.oracle.com/otn/java/olap/AWM102030_Win.zip
Analytic Workspace Manager demo:
http://www.oracle.com/technology/products/bi/olap/viewlet/AWM102_viewlet_swf.html
Oracle OLAP Spreadsheet Addin on OTN:
http://www.oracle.com/technology/products/bi/spreadsheet_addin/index.html
Spreadsheet Addin software:
http://www.oracle.com/technology/products/bi/spreadsheet_addin/download/index.html
Anyone who has an interest in data warehousing and/or business intelligence understands the concepts of dimensions and hierarchies, which are key parts of a multi-dimensional model. In most cases the structure of a hierarchy is driven the corporate business environment. For example, if we consider the common schema (SH) that is shipped with the 10g version of the database, the product dimension has one single hierarchy that is based on normal business levels: Categories, sub-categories and products.
Regular readers of this blog will might remember a posting from last year where I explained how you could use attribute importance to help determine the most important dimensions within a cube. This posting uses another data mining feature to help business users analyse product groupings.
Most people are aware of the concepts of a shopping cart from buying products online, and it can be extremely useful to track the contents of these baskets. Each basket can provide valuable insight into customer buying patterns and provide the opportunity to identify options for cross selling. Therefore, to analyse customer-purchasing behaviour we need to extract the following information
- Which product combinations are bought?
- When they are purchased? and in
- What sequence?
- What are my top 5 baskets?
- What are my bottom 5 baskets?
- Which baskets are the most profitable?
- How are my top 5 baskets performing in my key target regions
- How have my top 5 baskets been performing over the last 2 years
- What is the revenue forecast for next year for my top 5 baskets
One of the many benefits of Oracle’s 10g database is packed with features and the trick to getting the maximum benefit from the investment in Enterprise Edition is to make these features work together.
In this case we can use an association rules algorithm, part of Oracle Data Mining, to create an alternative product hierarchy that can be used to provide additional insight into business operations.
The association rules (AR) algorithm predicts the probability of co-occurrence among sets of attribute values. The most well-know use case for AR is market basket analysis, which predicts items occurring together in a market checkout session. This type of hierarchy can be used to help identify cross sell opportunities and product bundle strategies as well as product placement within online and the more traditional bricks and mortar stores.
Creating a Market Basket Analysis
Creating the association rules model
The sources for this example are the tables within the BI10g common schema. The SALES table contains point of sale data, which can be used as the main input to the market basket algorithm. To get started, you will need to have installed the Oracle Data Mining (ODM) Option (the default) during installation of the Oracle Database 10g. This ODM algorithm requires that the data be in this “transactional” format, with one item being represented in each row. This is an efficient representation, as any shopping basket will typically include several items from a possible hundreds or thousands of store items. The alternative, storing the data in a “single record per market basket”, would cause there to be hundreds to thousands of possible store items (attributes) with most of them being blank or null

Launch Oracle Data Miner client (for download details see the links at the end of this posting). Select Build from the Activity pull-down menu to launch the activity, and select Association Rules from the Function Type pull-down menu. Click Next.

The transactions (market baskets) are contained in the SALES table; select PROD_ID as the identifier for the items purchased. However, the products are identified only by an item code; the names of the products are in the PRODUCTS table, so click the checkbox indicating that there is a Name Lookup table, and select the table, the item identifier (PROD_ID), and the column containing the item description (PROD_NAME). This will then create meaningful product descriptions in the results table that can then used to populate the description for the dimension.
Click Next to continue.
 Two columns are required to identify a single market basket. Click the checkboxes for CUST_ID and TIME_ID, then click Next.
The final step is to enter a name for the activity and click Next. On the final page of the wizard, click Advanced Settings to see the parameters available for Association Rules. In this case the default settings can be used. However, there are a lot of parameters that can used to tune the model. For more information regarding these parameters please refer to the documentation for Oracle Data Mining 10g Release 2. This can be downloaded from OTN.
Click OK to return to the last page of the wizard and click Finish to run the activity. When the activity completes, click Result in the Build step to access the rules defined by the model.

In this example, 115 rules were defined using the default parameter settings based on the transactions listed in the sales table

As well as the details of the products that comprise the rule two additional columns are provided: Confidence (%) and Support (%). The Support for the rule is the percentage of baskets containing the items in the rule. In the example, Support is the percentage of all baskets containing the three items mouse, keyboard and printer.
The Confidence for the rule is the percentage of baskets containing the item(s) in the antecedents that also contain the consequent. In the example, consider only baskets containing keyboard and mouse and calculate the percentage of those baskets that contain printers.
Saving the results
Finally, the results from the model can be published to a table. This table will then form the raw source for the new OLAP product dimension. Notice at this point there is no information relating to revenue, costs or quantity. All that information is already contained in the existing fact table that is used to feed the standard sales revenue, sales costs and sales quantity measures. All that needs to be done is to link the product bundles to the original fact table to extract the revenue, costs and quantity for each product within a bundle. The process for doing this will be explained later.

Designing the product dimension
The results from the algorithm table have to be transformed to provide a correctly formatted source for the dimension mapping. This requires the use of either OLAP DML (for those used to this powerful language) or PL/SQL. The aim is to create a new dimension table that confirms to the normal requirements for a source table. Therefore, a new top level has to be added to provide a total for “All Rules” and columns need to be populated for each of the attributes.
Each rule has to be broken down into its constituent parts:
- The rule itself
- The products that are part of the initial purchase
- The products that are normally purchased in conjunction with the original items
This will allow us to track and analyze product bundles as part of the normal reporting process. Using the attributes associated with each rule, OLAP query steps can be created that further refine the analysis of product bundles by allowing business users to filter the results based on the value for % confidence associated with the rule.
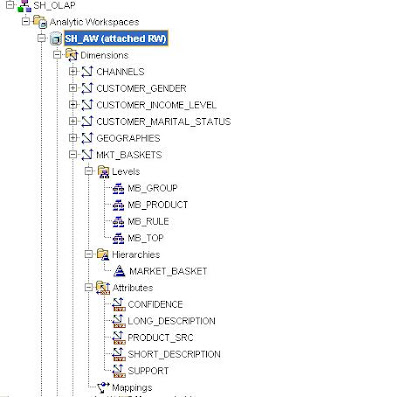
In this example the decision has been taken to create a separate dimension to hold the results from the algorithm. The dimension is based around a single hierarchy with the following levels:
- Top level – All Baskets
- Rule – Rule derived from the algorithm
- Group – Contains the IF and THEN parts of the rule
- Product – Base product
This structure is outlined below with the associated attributes of:
- Long description
- Short description
- Source product
- Confidence %
- Support %

The finished mapping looks like this:

Once the dimension has been maintained you can use the Dimension Viewer to check the results.

Designing the cube
The next requirement is to create a new source table that can be used in the mapping for the cube. Again some coding is required to create this new fact table. The code needs to extract the source products from each rule and identify the associated costs, revenue and quantity from the original fact table. This will then be moved to a new fact table to make mapping and loading data much easier to manager.
The new fact table looks like this:

When the cube is aggregated it will be possible to view the total revenue, total cost, total quantity, margin etc derived from the various products that are part of the rule.
A new cube called “MB” is created and the all the usual dimensions except in this case the new market basket dimension replaces PRODUCT dimension. The definition of the cube follows the same pattern as the other cubes in the sample schema.
In this case the figure for “All Baskets” which is the top level of the new market basket dimension is largely irrelevant. The reason for this is because the same product can appear in multiple rules, therefore, the value for total revenue, or total cost or total quantity is based on double counting of values. So this top value has to be treated with caution.
 Now it is possible to create all the usual calculated measures for each of the base measures associated with a product bundle (revenue, costs, quantity, and margin) , such as those linked to the other cubes that are part of the common schema sample. For example:
- 12 month moving average
- 6 month moving average
- Percent growth prior period
- Percent growth prior year
- Forecast
- % Share of total revenue
- % Share of total cost
- % Share of total quantity
MB_REVENUE/SALES_REVENUE(PRODUCTS '1')*100
All these new measures can finally be added to a new measure folder called Market Basket Analysis and everything is ready for access by Discoverer OLAP, BI Beans and/or Spreadsheet Addin.
So what does this provide? With this cube it will now be possible to answer the following types of questions:
- What are my top 5 baskets?
- What are my bottom 5 baskets?
- Which baskets are the most profitable?
- How are my top 5 baskets performing in my key target regions
- How have my top 5 baskets been performing over the last 2 years
- What is the revenue forecast for next year for my top 5 baskets
Viewing the Results in Excel
Using Spreadsheet Addin it is now possible to connect to the updated schema. Launching the query builder shows the new dimension (Product Market Baskets) and the associated new measures for the market basket analysis

With this new dimension it is now possible to analyze the performance of each basket in the context of % growth prior period, % growth prior year etc. An obvious report to create is to show the performance of the top 5 baskets based on % growth prior year for year 2000, within the USA across All Channels.

The results from this query can be plotted on a line graph to show the revenue trend over the last 8 quarters as shown below.

Links
To help you get started creating your own market basket analysis here are some links that might be useful:
Data Mining
Oracle Data Mining on OTN:
http://www.oracle.com/technology/products/bi/odm/index.html
Oracle Data Miner Client on OTN:
http://www.oracle.com/technology/products/bi/odm/odminer.html
Data Miner Client software:
http://www.oracle.com/technology/software/htdocs/devlic.html?url=http://download.oracle.com/odm/odminer/odminer10203/odminer.zip
Data Miner Client installation instructions:
http://www.oracle.com/technology/products/bi/odm/odminer/odminer_install_10202.htm
Data Miner Tutorial
http://download.oracle.com/odm/odminer/odminer_tutorial_10201.zip
OLAP
Oracle OLAP on OTN:
http://www.oracle.com/technology/products/bi/olap/olap.html
Analytic Workspace Manager software:
http://www.oracle.com/technology/software/htdocs/devlic.html?=http://download.oracle.com/otn/java/olap/AWM102030_Win.zip
Analytic Workspace Manager demo:
http://www.oracle.com/technology/products/bi/olap/viewlet/AWM102_viewlet_swf.html
Oracle OLAP Spreadsheet Addin on OTN:
http://www.oracle.com/technology/products/bi/spreadsheet_addin/index.html
Spreadsheet Addin software:
http://www.oracle.com/technology/products/bi/spreadsheet_addin/download/index.html
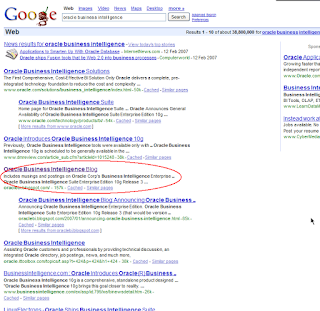
Vanity searches and the blog
On Google and Yahoo, the BI Blog (this blog) is ranked within the top 5 hits: #3 on Google, #4 on Yahoo. On Microsoft Live Search it comes up at #6.
Yay.
And for the first time since I started the blog in 2005, it's been getting 1000+ hits every weekday for two weeks now. For some reason people don't like to surf the BI Blog as much on weekends. Hmm, that certainly is inexplicable. What can be more exciting to do on a weekend?
The flip side is that my personal blog has not seen a new post in three weeks.


I don't really know what else label to apply to this blog...
Subscribe to:
Posts (Atom)