Pages

Wednesday, February 22, 2006

Oracle Development Survey on Data Warehouses: How Does Yours Compare? Here's how to find out!

At the start of most data warehouse projects, or even during a project, I am sure you as customers try to find answers to the following questions to help you plan and manage your environments:
  • Where can I find trend and comparison information to help me plan for future growth of my data warehouse?
  • How many cpu's do other customers use per terabyte?
  • How many partitions are typically used in large tables? How many indexes?
  • How much should I allocate for memory for buffer cache?
  • How does my warehouse compare to others of similar and larger scale?
The data warehouse development team, here at Oracle would like to help provide answers to these questions. However, to do this we need your help. If you have an existing data warehouse environment, we would like to obtain more technical information about your environment(s) by running a simple measurement script and returning the output files to us, here at Oracle. This will allow our developers to provide comprehensive documents that explain best practices and get a better understanding of which features our customers use the most. This will also allow you as Customers, to benchmark your environments compared to other customers’ environments.

From a Company perspective we are also interested to get feedback on features we have added to the database, are these features used, how are they used etc. For example we are keen to understand:
  • Which initialization parameters are most frequently used at what values?
  • How many Oracle data warehouses run on RAC? on single nodes?
  • Is there a trend one-way or the other, especially as data volumes increase?
  • Does this change with newer releases of the database?
All results from these scripts will be held confidential. No customers will be mentioned by name; only summaries and trends will be reported (e.g., “X percent of tables are partitioned and Y percent are indexed in data warehouses that are Z terabytes and larger in size.” or “X percent of Oracle9i and Y percent of Oracle10g data warehouses surveyed run RAC”). Results will be written up as a summarized report. Every participating customer will receive a copy of the report.

Terabyte and larger DW are the primary interest, but information on any data warehouse environment is useful. We would like to have as many customers as possible submit results, ideally by the end of this week. However, this will be an on going process so regular feedback after this week is extremely useful.

To help our developers and product management team please download and run the DW measurement script kit from OTN which is available from the following link:

http://www.oracle.com/technology/products/bi/db/10g/dw_survey_0206.html


Please return the script outputs using the link shown on the above web page, see the FAQ section, or alternatively mail them directly to me: keith.laker@oracle.com.

Thank you and we look forward to your responses.

Monday, February 20, 2006

More Oracle Executive Blogs

If you have been following my posts on blogging within Oracle (see last post here) you would have read my post on the new home page for links to Oracle related blogs: blogs.oracle.com

That page has been modified slightly, to bring it more inline with the look and feel of other pages under the Oracle.com domain.
Also, the number of exectutive blogs has expanded greatly - it has a nice mix from server technology & applications development, sales, education, and more.

Check them out on Oracle.com (link to page)

Jesper Andersen  John Hall  Luiz Meisler
Wim Coekaerts Lenley Hensarling Scott Rae
Don Deutsch Christophe Job John Schiff
Sergio Giacoletto Doug Kennedy John Wookey

Friday, February 17, 2006

Day 2 of RMOUG Conference

Day 2 of RMOUG Conference

Today's session were great. Again lots of good content backed up by real-life examples. I attended a really good session on the impact of Sarbanes Oxley presented by Steve Lemme, Director Product Management at CA. I have heard a lot about SOX but never really deciphered what exactly was the impact on DBAs. Steve's presentation explained all the usual acronyms that get thrown around by SOX people and then zoomed in on they key parts of legislation that affect DBAs. He then discussed the various frameworks that exist for managing compliance, such as COSO and COBiT. We then drilled specifically into COBiT and how this could be used within an IT environment to manage SOX compliance. A lot of the processed and checks that were outlined seemed like common sense, but I suppose the key thing about SOX is that someone is not legally accountable for data and failure can mean jail time. There is a lot of information out there on this subject and helpfully Steve listed the following websites where you can get more information:
  • www.isca.org
  • www.coso.org
  • www.itgi.org
and the Computer Associates site contains a lot of aticles that relate specifically to the impact on IT departmentsof SOX. Overall, the presentation contained a lot of good advice and I would recommend downloading or trying to find Steve's article if/when it is posted on the RMOUG site.

Following on from this was an interesting presentation on data quality which dealt with the practical methods of discovering data quality and matching the quality requirements to business objectives. The session was given by Bonnie O'Neil, an internationally recognized expert on data warehousing and business rules. Bonnie's presentation outlined a project she undertook at Yellow Pages and how their growth into a new area, the internet, uncovered major data issues. The presentation outlined the steps they took to ensure quality data within the organization. It go interesting when Bonnie showed the presentation that was created for senior management to explain the size of the problem and how it was going to be resolved. The final graphics generated by the management team for the presentation to the board were unusual and, for me personally, did not seem to highlight the size of the issue. The use of a piece of swiss cheese with holes was definitely too wierd for me. But the board got the message straight away and signed off on the project to correct the data. May be sometimes simpler is better. Who knows.

Overall, for me and I am sure all the attendees, this was a fantastic conference. Lots of great presentations containing material that you use as soon as you got back to your desk. I certainly learnt a lot from the many presentations I attended, which just goes to prove: you never stop learning.

The next set of conferences coming up are:

Next week:

ODTUG Virtual Desktop Conference, February 21-23rd. You can get more information from the following site:

http://www.desktopconference2006.org/

I will be presenting my Oracle World paper on combining data mining with OLAP.

Future events:
Collaborate 06 which is scheduled for April 23 - 27, 2006 at the Gaylord Opryland Resort, Nashville, Tennessee, USA. You can get more information from the Collaborate web site:
http://www.collaborate06.com/

ODTUG Kaleidoscope 2006
which is scheduled for June 17-21st at the Warman Park Marriot Hotel, Washington DC. You can get more information from the Collaborate web site:
http://www.odtug.com/2006_conference/2006_conference_location.htm

For Warehouse Builder we have five papers accepted for this conference, covering all the key new areas of the 10gR2 release. If you go to the following website and search for presenters "Keith Laker" and also "Jean Pierre Dijcks" you can get more details of the presentations

http://www.odtug.com/2006_Conference/2006_conference_papers.htm#bi_dw


Thursday, February 16, 2006

Rocky Mountain User Group Meeting,

Rocky Mountain User Group Meeting, Denver February 15-16th.

This week I am attending the RMOUG 2-day conference in Denver. This is one of the biggest (if not the biggest?) user groups, and this shows in the number of people attending the conference. Speaking to the organizing team yesterday on day 1, they said there were 960 registrations and countless walk-ins from members who work locally in the Denver area. Which makes this a great place for Oracle product managers to come and speak. There are a number of tracks
running across both days:
  • Database Administration
  • Data Warehousing
  • Application Design
  • Technology Management
  • Web Internet/Intranet


The quality of the presentations is exceptionally high and all the presentations are about real-life experiences gained on various projects and/or engagements. Today I attended some extremely interesting sessions on data warehouse design, change data capture, overview of data warehousing features and an introduction to Warehouse builder. All were very well attended and very well presented.


From a data warehouse design perspective the paper on EAV (Entity Attribute Value) data modeling caught my attention. I have used this technique many times as an OLAP consultant and seen other OLAP consultants use it when dealing with highly attribute driven data and the need to allow users to analyze data across any number of different attributes. However, this paper provided a formal framework for implementing this type of design which way beyond my modest efforts when I was in consulting. The presenter, Ralph Hughes from Ceregenics, was excellent. He had a fully worked example in his presentation that showed how to implement EAV using relational tables, allowing developers to create a data warehouse within weeks without having access to the complete data model or exact details of the types of attributes that need to be tracked. It would be interesting to try and implement some of this back at the office and see how it works, and more importantly, try applying to an OLAP data model.

Poor Man's Change Data Capture (CDC) was a great presentation on how to manage data changes in a data warehouse where you don't have the benefit of a formal CDC mechanism. Kent Graziano, who is well known and highly respected member of the ODTUG community, explained how to use the DECODE function to manage CDC in a very intelligent way. Again, code snippets were included in the presentation, which helped to explain how this would be implemented. This was another example of something you could just take straight back to the office and implement right away. These are the types of presentations that make conferences like this so successful. The pay back is immediate.

On my part, I presented a paper of modeling multi-dimensional data within Warehouse Builder. The aim was to show that moving forward and extending a data warehouse to use multi-dimensional model does not require ETL developers to learn a whole new way of modeling. We have simply extended the relational dimensional model to include additional multi-dimensional metadata. This means you can now model a logical dimension quickly and easily and then at run-time decide to implement it as a relational table, a relational multi-dimensional table or a dimension within an anayltic workspace. This logical modeling allows ETL developers to use all the normal data sources, extensive transformation library and process flow events when creating a true multi-dimensional implementation. This will move OLAP into the main stream as now there is no reason to not include OLAP as part of your data warehouse model.

The final session I attended was by Jon Arnold on Warehouse Builder. This was a great introduction to the product. Jon has a lot of experience of data modeling and building data warehouses and this certainly came out during the presentation. He used a lot of examples based on his work at Denver Public Schools. Which again goes back to the heart of this conference. Real people talking about real world implementations. Which is what everyone wants to hear, right? If the session library of white papers and presentations are hosted on the RMOUG website I would certainly encourage everyone to download them as each one is packed with useful information.

Day 2 is just starting so I will provide more feedback tomorrow on the events and session from day 2.

Wednesday, February 15, 2006

The Oracle Data Mining Blog

Marcos Campos, Development Manager with Oracle Data Mining Technologies, has started an Oracle Data Mining blog at http://oracledmt.blogspot.com/

Check it out.

Tuesday, February 14, 2006

Flash based introduction of Oracle Data Warehousing now available

A Flash based animation that provides a basic introduction to Oracle Data Warehousing is now available on Oracle.com.

Click here to view the animation directly, or click here to go to the Oracle Data Warehousing page on Oracle.com and click the "Oracle Data Warehousing Overview Demo" link to launch the animation (disable pop-up blockers).

The animation runs for about two and a half minutes, and you can choose to view it with or without English language captions.

Saturday, February 11, 2006

Blogs dot Oracle dot com - Finally here

I use Statcounter.com to keep track of web hits and statistics on this blog, and the number one referring link to this blog today is blogs.oracle.com! Yippee!!
Blogs have finally found their rightful place of importance at Oracle, as I had hoped they would, and as I had posted about a few days back (link to post). Also, an official blogging policy was announced that is short, concise, and common sensical.

So which are some of the other interesting blogs on the blogs.oracle.com site? I haven't gone through all, but here are some you may want to check out:
Oracle Employee Blogs
Sue Harper (Product Manager, Project Raptor)
Tom Kyte (VP, asktom.oracle.com)
Brian Duff (Software Engineer, Developer Tools)
Greg Pavlik (Architect, Web Services)
Jonas Jacobi (Product Manager, ADF Faces)

Non Oracle Employee Blogs
I have not gone over most of the blogs listed here, but I one that I do read on a regular basis is Mark Rittman, BI/DW Developer

Friday, February 10, 2006

More on Oracle BI and Siebel Analytics

Ok... so I am not writing about the proucts themselves. I shall get to that - Siebel's BI products, their analytic platform, components, the direction going forward, the other stuff - eventually...

But in the meantime, this past week has seen a surge in BI related announcements from Oracle management. This can be attributed to the fact that the Siebel acquisition has cleared shareholder vote (99% of shareholders voted for the merger - see link to story on eWeek) and now Oracle is starting to spell out, publicly, its strategy for the different products and technologies that it is getting from Siebel. Oracle had made it clear at the time it announced the acquisition itself that Siebel CRM would be "the centerprice of our CRM strategy going forward... (we) will continue to sell PeopleSoft CRM, Oracle CRM, but Siebel will be the centerpiece.", according to Larry Ellison (link to story on C|Net).

As Oracle digged deeper into the products and technologies that Siebel had, it emerged that their analytics applications and suite was also an appealing offering.

Read below for what Oracle executives have had to say about this topic:


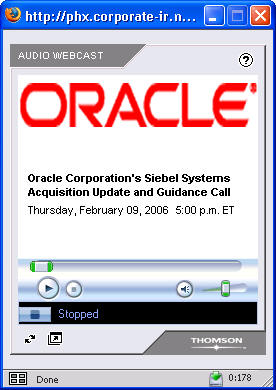
There was an "Oracle's Siebel Systems Acquisition Update and Guidance Call" with analysts on February 9, 2006 where Oracle Executives discussed acquisition of Siebel Systems (link to Oracle Investor page) - the webcast is going to be available only through Feb 14, so the while the link here will take you to the Oracle.com investor relations page, the link on that page that takes you to the webcast may not work a week from now.
(The image at the left shows the audio webcast stream)

Anyway, about 32 minutes or so into the call a CSFB analyst popped the BI question, and wanted to know more about Oracle's intentions regarding Siebel's analytics solutions and the sales force associated with selling the products and applications.
Charles Philips, Oracle's President (link to the Oracle Executives page) replied to that question. The gist of his reply (and while I did try and type down what was being said, I may not have got all that was said correctly, so please do not hold me to the exact words) was two fold; the first part dealt with the organization of the Siebel Analytics sales force within Oracle and the second part with the product suite itself.
He (Charles Philips) mentioned that Siebel managed to do a lot of revenue with a small number of analytics reps. They had 31 sales reps and about 30 pre sales reps (their analytics revenues were $100+ million last year). Oracle sales reps obvioulsy also have a lot of experience and skills in selling middleware, databases, ETL tools, and business intelligence, and the direction post-acquisition is going to be to add these Oracle people (with these BI selling skills) along with the Siebel Analytics sales reps and have a combined and expanded sales force.
The second part of his reply mentioned what has already been publicly stated by Oracle executives (including Charles Philips): that the Siebel Business Analytics suite brought to the table a piece of the solution that had been missing in Oracle's middleware stack - a world class analytic product. And now that Oracle has this product it can go and aggressively sell BI with this. This addition is also one of the most exciting pieces in the technology side that comes to Oracle with this acquisition.

Larry Ellison added to this by saying that close to 25% of Siebel's license revenue came from selling these analytic apps. They (Siebel) were selling it attached to their apps 95% of the time. Oracle would expand this and the analytic apps not only attached to the Siebel (CRM) stack but also with PeopleSoft and Oracle apps.

Larry also stated that a lot of the BI technology comes out of the database (if you look at such BI related database technologies as MVs, partitioning, OLAP, SQL Analytics, Data Mining, etc...). If on the other hand you shave away the database (contribution to BI), and look only at the middleware, and look at Oracle's products vs Siebel products, Siebel have already built the next generation of metadata driven business intelligence and have the best product out in the market.

The intent is clear - Oracle is very, very serious about business intelligence and that we now also have the kind of complete solution that go and compete and win, every single time. This is an exiciting time to be in BI in Oracle (err... yes, really). You have the product(s), you have the intent, and you also have the executive visibility that can drive people to achieve that much more.

You can also read about Oracle's comments on BI and Siebel in a press report in CRN (link to CRN page):
"
In addition, Oracle plans to highlight Siebel's analytics know how and will push those tools not only as standalone products but with its middleware, Ellison said, calling those tools a "hidden jewel" of the $5.85 billion Siebel acquisition, which was completed last week.


Siebel's analytics technology will "absolutely" be the foundation of Oracle's business intelligence effort going forward, Ellison said. There also will be an analytics "overlay" sales force to assist on sales of business intelligence that will work with applications and middleware sales teams, Ellison said.
"

Separately, BizIntelligencePipeline (link to article) had a story where Gartner estimates that the market for BI will reach $2.5 billion this year.
"
The Stamford, Conn.-based firm further projects ongoing growth through 2009, when license revenue is expected to reach $3 billion. The findings, based on a Gartner survey of 1,400 CIOs, indicate that business intelligence has surpassed security as the top technology priority this year.

"

George Shaheen, CEO when Oracle and Siebel agreed on the deal, had this to say about BI and Siebel (link to story on SearchCRM.com dated Oct 19 2005)
"
That is an absolutely sleeping giant in our portfolio. That's a $15 billion to 18 billion market where there's no one clear market leader. I had very high expectations for the role of business analytics.
"

The person who ran the analytics show at Siebel is Larry (yes, another Larry) Barbetta (who had founded nQuire, an analytics company that Siebel acquired in 2001), and this is what he had to say in the same article on analytics:
"
It's beyond intuitive, it's obvious," said Larry Barbetta, senior vice president and general manager of Siebel business analytics. "That's what the goal needs to be."
Oracle's plans for the future of Siebel's Business Analytics application has yet to be determined, as does its interoperability. "We have a stated mission to interact with all systems," Barbetta said. "You want to know about Oracle, there's another Larry [Ellison] you need to talk to.
"

You can read more about the Siebel Analytics Platform, its analytic applications, and the components therein at the Siebel web site - (link to page).

And if this is not all, a day earlier, on Feb 08 2006, Larry Ellison (link to story on C|Net) stated at the 2006 Credit Suisse Global Software Conference (link to conference page) that Oracle would be willing to do acquisitions in the BI space to become the #1 player there...
Snippets from the article:
"
Ellison told a Credit Suisse investor conference that the business intelligence and middleware market--which he considered as one--represented an area where Oracle was clearly not the leader and needed to make deals to gain a leading position.


"We are clearly not No. 1 in middleware," said Ellison, whose remarks were Webcast. "You will see us do a number of things in that space, including acquisitions.
"


More details to follow in March - watch this blog.
Addition: Added section on Larry Ellison's announcement at the CSFB conference on its intentions to do BI related acquisitions.

Thursday, February 09, 2006

Using Excel as a data source for building dimensions and cubes

Did you know you could use data stored in Excel as a source for populating dimensions and cubes created within Analytic Workspace Manager? If not then read on…

During a recent meeting we were discussing how to create a hierarchy editor for use within our various data modeling products. My response was that most people manage their hierarchies in Excel, so why not just read the hierarchy directly from Excel. As a consultant, building a multi-dimensional model was always a process of collecting two data sources for each dimension. First you walk down to the IT department and ask for access to the source table(s) to create a specific dimension. Then walk back to the users and ask them for their spreadsheets that actually contained the hierarchy they had modeled outside of the database. The dimensions modeled in most data warehouses are never quite what users want or at worst reflect structures that don’t actually relate to how the users manage their business.

Anyway, back to the meeting…so the response was: “Well we cannot read data from Excel, end of story”. After a quick chat with some of the Warehouse Builder Product Managers I found we could in fact read data directly from Excel and it is extremely easy – assuming you have your Oracle database running on Windows, otherwise this gets very expensive as ODBC drivers for UNIX are not cheap.

So assuming you have Excel and your Oracle database instance is running on a Microsoft platform how would you do get data from an Excel worksheet into your multi-dimensional model? Lets assume you are a Category Manager and you want to reorganize your brands across existing sub-categories and also create some new categories. Then you want to analyze the effect on revenue and costs across each subcategory and may be even forecast future revenue and costs as well. Most managers use Excel because it is everyone’s favorite desktop productivity tool. So you create a take a download of your product dimension data into Excel and model the new hierarchy directly within Excel. Now how to do you get that new model back into your multi-dimensional model to see the results….

Following the scenario above the steps below show how you could use the Excel Worksheet as a source within Analytic Workspace Manager to populate a dimension.

1) Step 1 – get the original Product hierarchy into Excel

In Excel you can connect directly to your Oracle instance using the normal ODBC connection processes. Using the Data Source Administrator that is part of Windows XP you can define a new DSN source to connect to your Oracle database instance:


The Server references my TNSNAMES.ora entry that connects to my Oracle instance. In this case I am connecting to the SH schema. Next step is within Excel


The query wizard allows me to choose a source table, in this case I have selected the Products table:


Finishing the wizard loads the data directly into Excel


Now the products table can be modified to remodel the hierarchy simply by using Cut and Paste to move the cells around. It would be really nice to be able to use the Excel Outline mode so the hierarchy could be edited and viewed like a normal hierarchy. The only problem is this implies reading an embedded total dimension within Analytic Workspace Manager and it seems this is not currently supported. However, I have a simple workaround for this. I will cover this in another blog.

OK, we have the new model ready in Excel. Next we define a named data range that covers all the dimension members. This range name is how we will refer to the data from within SQLPlus.

2) Create a new ODBC source for your worksheet

Now the spreadsheet is complete we need to copy it to the Windows server hosting our Oracle database instance. Once the file is on the server we can create an ODBC connection to the Worksheet using the Data Source Administrator tool. Note, this time we are creating the ODBC on the Server machine.


3) Configuring Oracle to use ODBC

This section will appear to be very scary, but as long as you follow these steps nothing can wrong. Trust me. After you have done one ODBC source setting up the next one is easy as riding a bike. Just remember to write down the names you use at each step.

When you install an Oracle database we also install something called heterogeneous data services. This is a little known free option that is actually very powerful.

First you need to setup a data source: In the Oracle Home on your server there is directory called “hs”, for example on my server the directory is e:\oracle\product\10.1.0\Db_1\hs. In this directory there is an admin directory and you need to create file called “initODBCName.ora”. In this example I created a file called initProdBEANS.ora. This file contains the following lines


# This is a sample agent init file that contains the HS parameters that
# are needed for an ODBC Agent.
# HS init parameters
HS_FDS_CONNECT_INFO = Prod
HS_AUTOREGISTER = TRUE
HS_DB_NAME = hsodbc

The HS_FDS_CONNECT_INFO should point to the name of you’re the reference you created in the ODBC Data Services Administrator.

Secondly you need to update the database Listener configuration file to refer to the new ODBC data source. Use notepad to edit the Listener.ora file located in your ORACLE_HOME\Network\admin directory. In the SID_LIST_LISTENER section add an entry similar to the following:

(SID_DESC =
(SID_NAME = ProdBEANS)
(ORACLE_HOME = E:\oracle\product\10.1.0\Db_1)
(PROGRAM = hsodbc)
)

The SID_NAME is the reference to the name of the file you created in the previous step minus the “init”. So in this case the file was called “initProdBEANS.ora”, therefore, the SID_NAME is “ProdBEANS”. Now reload the listener configuration file using LSNRCTL RELOAD and check the new SID is available using LSRNCTL STATUS. The new SID, ProdBEANS, should be listed.

Last step is to add a TNSNAMES entry to allow us to point to the new SID quickly and easily when we setup the database link.

PRODBEANS =
(DESCRIPTION =
(ADDRESS = (PROTOCOL = TCP)(HOST = klaker-svr.us.oracle.com)(PORT = 1521))
(CONNECT_DATA =
(SID = ProdBEANS)
)
(HS=OK)
)


4) Creating a view in the database

To be able to view the data from Excel we need to create a database link to allow us to connect to the Excel Worksheet and then a view that is based on the source data range we defined in Excel.

In SQLPlus, assuming you have the correct privileges, create a database link as follows:

Create database link ProdBEANS connect to SCOTT identified by TIGER using ‘PRODBEANS’

We can now use the database link to define the source table for our view that will pull data directly from Excel.

Create view EXCEL_PRODUCTS as select * from PRODUCTS@ProdBEANS


5) Create a mapping using Analytic Workspace Manager

This view can now be used as a source view within Analytic Workspace Manager to populate a dimension. Having created the dimension using the AWM wizards the mapping process is simply a question of drawing lines between the columns in the view to the corresponding levels/attributes in the dimension.


There you have it, using Excel as a data source for your multi-dimensional model. You can do all your hierarchy design within Excel and then quickly and easily load the results.

Tuesday, January 31, 2006

Blogs on Oracle.com coming soon?

So far the only official Oracle blogs have been by some of the senior mangement folks in the Apps division: John Wookey, SVP of Applications Development, Jesper Anderson, SVP of Applications Strategy (formerly from PeopleSoft), and John Schiff, VP and GM of JD Edwards World (link to executive blogs page on Oracle.com). But no other employee blogs are hosted on Oracle.com.

On a lark I entered www.oracle.com/blogs in my browser. I first got redirected to http://www.oracle.com/blogs/index.html and then to http://www.oracle.com/technology/community/opinion/index.html, which happens to be the home page for all links to Oracle technology related blogs.

I am using this very sparse and frankly thin piece of page redirects evidence to surmise that Oracle may come out with a comprehensive blogging infrastructure like hosting support (like a blogs.oracle.com or other URL) and software for blogs. Currently, as people would know, Oracle blogs are hosted on third-party blogging sites like Blogger, Livejournal, or on Orablogs.com. Companies like Sun, Microsoft, and others have a substantial blogging presence by their employees.

App Server 10.1.3 is now available

For those who missed it, Oracle Application Server 10g Release 3 (10.1.3), is now RTM and available for download from OTN (link to download page).

This is just the first of the R3 releases, and the version number reflects that (10.1.3.0.0). This contains the core app server components like Oracle HTTP Server, Oracle Application Server Containers for J2EE (OC4J), Oracle Enterprise Manager 10g Application Server Control, Oracle Business Rules, and Oracle TopLink.

Portal, Integration, BI components and more will be added to this in later releases. So, for those who may ask, "what is the latest Discoverer release", the answer continues to be 10.1.2.48.18, available with Oracle Application Server 10g Release 2 (10.1.2.0.2), available from this download page. If you want the latest Discoverer release, then this is the version that you need to download and install.

And for those clued in on the RSS revolution, OTN has added a new page for new downloads (link to page) as well as an RSS feed (link to RSS XML feed) so people can simply add the feed to their favourite RSS reader (think Thunderbird) and see a list of new downloads added.

Saturday, January 28, 2006

How Do You Debug OLAP DML from BI Beans Part 2

This is part two of a post covering how to debug OLAP DML from BI Beans. The first session explained how to enable tracing of OLAP DML from BI Beans. This session explains the output from the various debug options. There are three basic options
  • Prgtrace
  • Monitor
  • Trackprg

In addition Badline can be used to uncover additional information about an error.

Prgtrace
Controls whether each line of a program is recorded in the current session. It is used to uncover problems by tracing the execution of a program and records the name of the current program and shows the line of code being executed. In the example below the program being called is RUN_FCAST_MODEL, which in turn calls CALC_FCAST_MODEL. Prgtrace can be used to examine program flow within a session. Below is an example of the output when prgtrace is enabled:

(PRG= UTILS!RUN_FCAST_MODEL) argument T_PRESCONTEXT text
(PRG= UTILS!RUN_FCAST_MODEL) argument T_DIMCONTEXT text
(PRG= UTILS!RUN_FCAST_MODEL) argument T_DEBUGCONTEXT text
(PRG= UTILS!RUN_FCAST_MODEL) argument T_TIME_FP text
(PRG= UTILS!RUN_FCAST_MODEL) argument T_TIME_PP text
(PRG= UTILS!RUN_FCAST_MODEL) argument T_METHOD text
(PRG= UTILS!RUN_FCAST_MODEL) argument T_MEASURE0 text
(PRG= UTILS!RUN_FCAST_MODEL) argument T_MEASURE1 text
(PRG= UTILS!RUN_FCAST_MODEL) argument T_MEASURE2 text
(PRG= UTILS!RUN_FCAST_MODEL) argument T_MEASURE3 text
(PRG= UTILS!RUN_FCAST_MODEL) argument T_MEASURE4 text
(PRG= UTILS!RUN_FCAST_MODEL)
(PRG= UTILS!RUN_FCAST_MODEL) variable T_MEASURE text
(PRG= UTILS!RUN_FCAST_MODEL) variable T_MODE text
(PRG= UTILS!RUN_FCAST_MODEL) variable T_VAR text
(PRG= UTILS!RUN_FCAST_MODEL)
(PRG= UTILS!RUN_FCAST_MODEL) trap on ERROR
(PRG= UTILS!RUN_FCAST_MODEL) pushlevel 'RUN_FCAST_MODEL'
(PRG= UTILS!RUN_FCAST_MODEL) push SHAWPRODUCTS, SHAWPROMOTIONS, SHAWCHANNELS, SHAWGEOGRAPHIES, SHAWT_TIME, prgtrace, badline
(PRG= UTILS!RUN_FCAST_MODEL)
(PRG= UTILS!RUN_FCAST_MODEL) context T_PRESCONTEXT apply
(PRG= UTILS!RUN_FCAST_MODEL)
(PRG= UTILS!RUN_FCAST_MODEL) switch upcase(T_METHOD)
(PRG= UTILS!RUN_FCAST_MODEL) case 'SEASONAL':
(PRG= UTILS!RUN_FCAST_MODEL) T_MODE = 'WINTERS'
(PRG= UTILS!RUN_FCAST_MODEL) break
(PRG= UTILS!RUN_FCAST_MODEL)
(PRG= UTILS!RUN_FCAST_MODEL) if T_MEASURE1 eq 'on'
(PRG= UTILS!RUN_FCAST_MODEL) else if T_MEASURE2 eq 'on'
(PRG= UTILS!RUN_FCAST_MODEL) else if T_MEASURE3 eq 'on'
(PRG= UTILS!RUN_FCAST_MODEL) else if T_MEASURE4 eq 'on'
(PRG= UTILS!RUN_FCAST_MODEL) then T_MEASURE = 'SHAWSALES_AMOUNT_SOLD_VARIABLE'
(PRG= UTILS!RUN_FCAST_MODEL)
(PRG= UTILS!RUN_FCAST_MODEL) if T_MEASURE eq 'SHAWSALES_MARGIN_PERCENT'
(PRG= UTILS!RUN_FCAST_MODEL) else CALL calc_fcast_model(T_MODE, T_MEASURE, 'SHAWSALES_AMOUNT_SOLD_FCAST_BF_VARIABLE')
(PRG= UTILS!CALC_FCAST_MODEL) "============================================================================================================================
(PRG= UTILS!CALC_FCAST_MODEL) " Created by Keith Laker November 2002
(PRG= UTILS!CALC_FCAST_MODEL) " Modified by Dave Wild : 17th Dec 2002
(PRG= UTILS!CALC_FCAST_MODEL) " Modified by Keith Laker : 29 Aug 2003
(PRG= UTILS!CALC_FCAST_MODEL) "============================================================================================================================
(PRG= UTILS!CALC_FCAST_MODEL) " This Program creates AW forecasts using one of the following AW Foprecasting methods
(PRG= UTILS!CALC_FCAST_MODEL) " These methods are passed into this program as arguments via _method
(PRG= UTILS!CALC_FCAST_MODEL) (PRG= UTILS!CALC_FCAST_MODEL) "
(PRG= UTILS!CALC_FCAST_MODEL) " T_METHOD arguments include:
(PRG= UTILS!CALC_FCAST_MODEL) " WINTERS - Holt Winters Seasonal
(PRG= UTILS!CALC_FCAST_MODEL) " TREND - Trend
(PRG= UTILS!CALC_FCAST_MODEL) " EXPO - Exponential


Each line of code that is shown contains important information. For example, if the start of the line includes an equals sign, this indicates the code is executed as a compiled line of code:

(PRG=RUN_MODEL)limit SHAWT_TIME to '1813'

if line includes a colon, this indicates execution of uncompiled code. Typically, uncompiled code is slower to execute than compiled, as it has to be parsed and validated prior to execution. If the line is executed within a loop then this could consume a large amount of processing time.

(PRG:RUN_MODEL)limit SHAWT_TIME to &arg1

Uncompiled code usually occurs when dynamic substitution is used to alter the way a line is executed as shown above. In this case the time dimension is limited to a specific dimension member that is not known until execution time. Hence the &arg1 is used to parse the first argument passed to the program.


Badline
This can be set to get more detailed error messages in the log file and may help to provide more information regarding a particular issue.

Monitor
The MONITOR command records data on the performance cost of each line in a specified program. It is used to identify the time-consuming lines within those programs.–If the program executes a given line repeatedly, MONITOR records the cumulative cost of all the executions on the single line –A line of code is considered to have a high performance cost if it takes a long time to execute. If you wish, you can use both TRACKPRG and MONITOR simultaneously.


Trackprg
Tracks the performance cost of every program that runs while you have tracking turned on. Each time each program is executed, TRACKPRG stores its cost data as one entry in its tracking list. A program or line of code is considered to have a high performance cost if it takes a long time to execute. Use TRACKPRG to identify programs that have relatively high costs and then use the MONITOR command to identify the time-consuming lines within those programs. If you wish, you can use both commands simultaneously.


With the help of these three debugging options it is possible to determine how and why programs are being executed within the AW. Once you know where the problem is, then you can use the OLAP Worksheet within Analytic Workspace Manager to edit the program and make the required changes.

It is always a good idea to test any OLAP DML program within the OLAP Worksheet first before attaching the program a JSP page or calling it from another application. That way you can resolve the more obvious issues first. More technical issues can then be resolved using PRGTRACE, MONITOR and TRACKPRG as described

Tuesday, January 24, 2006

Press clippings in the media for Open World Mumbai

  • Economic Times (link to article)
  • The Afternoon, India (link to article)
    "Oracle India Managing Director Krishan Dhawan also announced that the conference theme would be Information Empowers, saying, “Information is the new currency in the global market. Indian companies are increasingly becoming a part of the global economy and are realizing the importance of empowerment through information to effectively compete at global levels."
  • Pakistan Link (link to article)
    "In the past five years, Oracle invested nearly $2 billion in India to support company initiatives, such as its development centres, in-kind education donations, investments in companies like i-flex, and commitment to employees.
    Under the new expansion plans, Oracle is scheduled to increase its presence in nine non-metro cities, including Ahmedabad, Chandigarh, Coimbatore, Indore, Jaipur, Kochi, Lucknow, Pune and Vishakhapatnam.
    Oracle expects to increase its total headcount in India to 10,000 over the next eight months."
  • 24x7 Updates (link to article)
    "Oracle will also rewrite its software in seven new Indian languages, in order to cover all the national languages. Besides this, the company has assured that it will be flexible on payment schedules for contracts involving smaller firms or rural projects in India."
  • Rediff (link to article)
  • Red Herring (link to article)
    "Research firm IDC estimates that IT spending in India has reached $9 billion in 2005 and will grow to more than $17 billion in 2009. Only about 1 percent of Oracle’s revenue already comes out of India, FTN Midwest’s Mr. Chowdhry said.
    Currently, more than 80 percent of Indian banks and 90 percent of Indian telecommunications companies are Oracle customers. The company has more than 6,000 database and middleware customers and 400 applications customers in India."
  • The Telegraph India (link to article)
    "“India and China are the two key markets for us as far as the Asia-Pacific region is concerned,” Oracle senior vice-president (Asia-Pacific) Keith Budge told reporters here today. “India is being increasingly seen as a priority market for research and development and services,” he added."
  • Digital Media Asia (link to article)
    "Oracle is also currently working with 28 Indian state governments to develop, test and deploy e-government projects in the country. The software company said it is currently engaged in more than a hundred Indian government projects. "
  • Sify (link to article)
    "Oracle is in talks with the Government for use of its database products for Village Service Centres (which will provide a range of information and records), the company is awaiting cabinet clearance for this, he said. Other large e-governance projects in which Oracle is interested are the national ID project, customs and excise department projects."

All Open World Mumbai 2006 Links

In one place, includes posts on OOW Mumbai 2004 and 2006, as well as photos of the city.

Siebel Analytics and the Oracle acquisition

Mark Rittman has a post (link to post) on his blog titled 'Siebel Analytics - The Jewel in the Project Fusion Crown?' with a brief overview of Siebel analytics and speculation on how Siebel Analytics and Oracle BI may integrate.
I suspect there are at least two reasons for the rising speculation that Oracle may have plans for Siebel Analytics:
  • The fact that Siebel Analytics had been a success story for Siebel, and in the last year contributed upwards of 20% of Siebel's total license revenue. Siebel Analytics had also been rated by Gartner (link to Gartner site) as having the most complete vision (completeness of vision and ability to execute being the two dimensions on which Gartner rates vendors in its Magic Quadrants). I don't have any publicly shareable links to these magic quadrants, but you may be able to find something on Siebel's web site (http://www.siebel.com/)
    A little searching on the net (ok, all I did was 'Google' around) shows that Siebel bought a company called nQuire in Oct 2001, that had been founded by Larry Barbetta in late 1999. This acquisition brought to Siebel nQuire's integrated zero footprint web client and an analytics server. This acquisition is what Siebel built upon and is now Siebel Business Analytics version 7.8 (released late last year). Larry B is now SVP and GM of Siebel Business Analytics.
  • Public statements from Oracle executive management advertising Siebel's BI applications as "hidden jewels" (link to article).
Once things are finalized and senior management communicates its direction and vision for BI - the what, how, and why - I shall bring it here, on the Oracle BI Blog.