Wednesday, November 30, 2005
Discoverer Is Not Supported On XE
I wanted to clarify one issue here, explicitly. Discoverer and the Oracle Database 10g Express Edition (aka XE) are not supported. I realize that it may appear to some people that because Discoverer relational works on XE (with the exception of some functionality) and because I, as an Oracle BI PM have been posting about this to the whole world, that there is some official sanction to this. That is not the case. Discoverer and XE are not supported.
Using BI Beans with non-OLAP data source
One of the largest threads currently running on the BI Beans forum relates to using BI Beans with non-OLAP data sources. Out of the box most of the BI presentation beans are wired to work with an OLAP data source. That OLAP data source can be derived from either a relational star/snowflake schema or an analytic workspace. The use of an OLAP data source against a relational schema requires additional metadata to be added in the form of registration of dimensions and cubes within the CWM repository.
In many cases the creation of this additional metadata may not be possible, so people have asked if it is possible to connect BI Beans to a non-OLAP data source. The answer is yes. The easiest way to do this is to use the BI Graph bean and connect this to an XML data source. This is relatively easy to do and as part of the BI Beans 10g samples we already provide a UIX example that shows how to connect a BI Graph bean to an XML data source. Now we have added a JSP example.
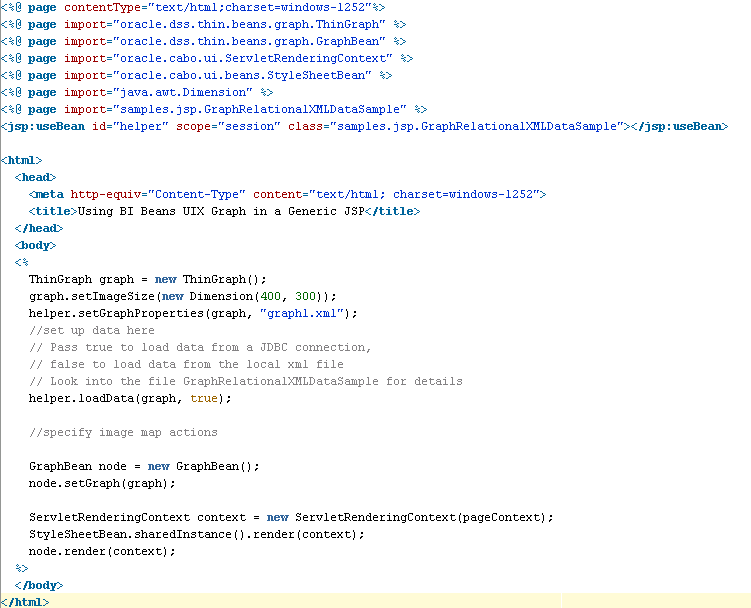
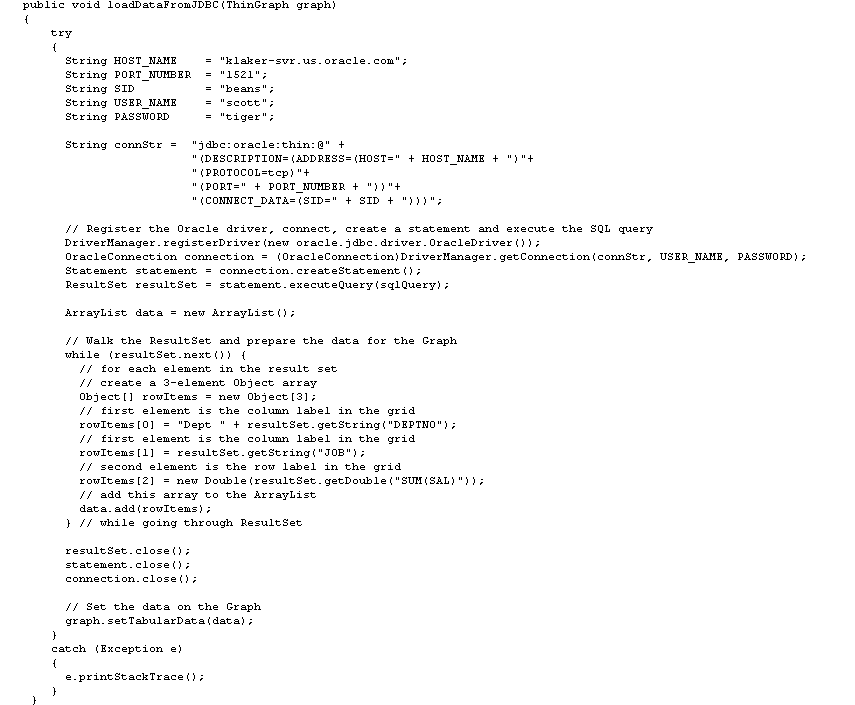
Using a very simple JSP page we can add a new BI Graph bean and render this with data from an XML data source. The code below shows the completed JSP page with all the require libraries and tags:

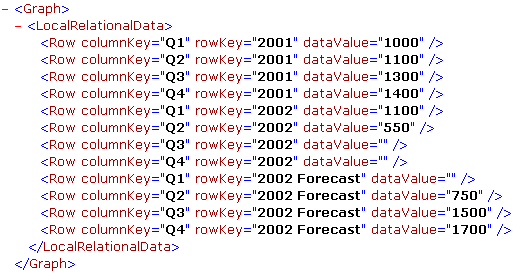
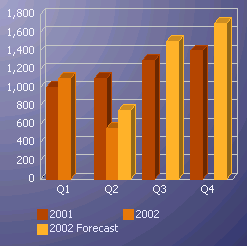
This code loads an XML file that contains the following tags and data points:

which results in the following graph being displayed when the JSP is run:


For this example we connect to the Scott schema and select data from the EMP table. The connection details to the instance are coded into this example; however, these could be stored and loaded from another file if required. Note here the lack of a BIDesigner connection, this is an area that also generates a lot of questions on the forum. There is no need to define a BIDesigner to make a non-OLAP connection. The connection is defined as per a normal ODBC connection.
The SQL statement is contained within a String object and is defined as follows:
String sqlQuery = "select DEPTNO, JOB, avg(SAL)from EMP group by DEPTNO, JOB";
Executing the query in a SQLPlus session will generate the following result:


In many cases the creation of this additional metadata may not be possible, so people have asked if it is possible to connect BI Beans to a non-OLAP data source. The answer is yes. The easiest way to do this is to use the BI Graph bean and connect this to an XML data source. This is relatively easy to do and as part of the BI Beans 10g samples we already provide a UIX example that shows how to connect a BI Graph bean to an XML data source. Now we have added a JSP example.
Using a very simple JSP page we can add a new BI Graph bean and render this with data from an XML data source. The code below shows the completed JSP page with all the require libraries and tags:
In this example the JSP page includes two key lines of code:
Line 1: helper.setGraphProperties(graph, "graph1.xml");
Line 2: helper.loadData(graph, false);
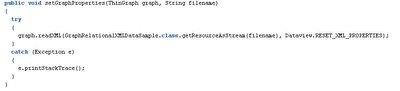
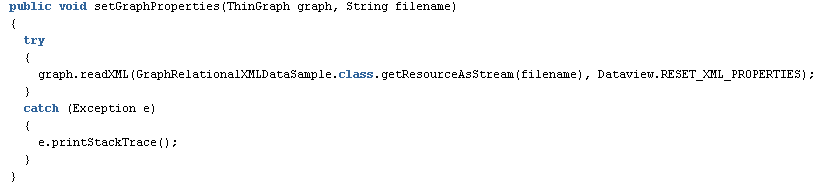
The first line sets the style properties for the graph. Below is the code used to load the style information and apply it to the graph:
For more information on setting the various graph properties and styles using the XML tags please refer to my previous posting “Beyond the BI Graph”. This can be found at the following URL:
http://oraclebi.blogspot.com/2005/11/beyond-bi-graph-wizard.html
The second line of code creates a connection to a non-OLAP data source for the graph and is contained within the same code library as the previous, code extract, GraphUIXSample.java. The loadData() method allows for two different types of connections. By passing the value of “false” as the last parameter the graph will be generated using data from an XML file, "helper.loadData(graph, false); ". This will call the following code:

This code loads an XML file that contains the following tags and data points:
which results in the following graph being displayed when the JSP is run:
By passing the value of “true” as the last parameter ( helper.loadData(graph, true) )the graph will be generated using data from a SQL statement. This will call the following code:
For this example we connect to the Scott schema and select data from the EMP table. The connection details to the instance are coded into this example; however, these could be stored and loaded from another file if required. Note here the lack of a BIDesigner connection, this is an area that also generates a lot of questions on the forum. There is no need to define a BIDesigner to make a non-OLAP connection. The connection is defined as per a normal ODBC connection.
The SQL statement is contained within a String object and is defined as follows:
String sqlQuery = "select DEPTNO, JOB, avg(SAL)from EMP group by DEPTNO, JOB";
Executing the query in a SQLPlus session will generate the following result:
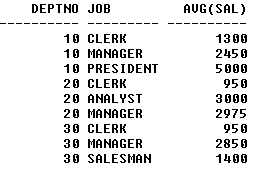
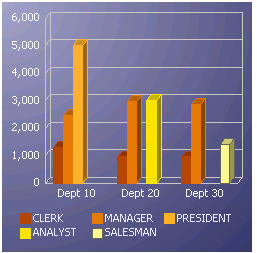
The query results are assigned to an array called “data” using a “while” loop to walk-through the result set. To assign the data to the graph the setTabularData() method is called:
graph.setTabularData(data);
Running the JSP page now will generate the same style of graph as before, however, the data will now be sourced from the EMP table and will appear as follows:
Expiration of scheduled workbooks
Here is a short example of how scheduled workbooks in Discoverer expire. Consider the example below where I have scheduled a workbook to run every 1 minute. Also, I have specified that the results should be deleted after 1 day.
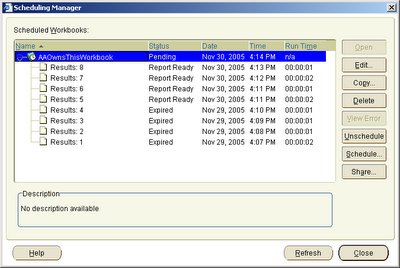
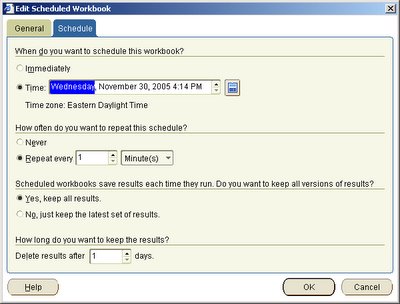 In theory, I should have at most 24 x 60 = 1440 results for this given workbook available. Well, I was not about to wait one whole day, so I did the next best thing. I simply reset my machine's clock forward by one day, restarted my middle-tier services (actually only the process manager: OracleasProcessManager in my case), reconnected to Plus, and launched the Discoverer Scheduling Manager. Now, my system clock said something like Nov 30, 2005, 4:15pm. Therefore, all results from Nov 29 that had run before 4:15pm should have expired. If you take a look at the screenshot below, it will confirm the same: four results have expired and will be deleted.
 In theory, I should have at most 24 x 60 = 1440 results for this given workbook available. Well, I was not about to wait one whole day, so I did the next best thing. I simply reset my machine's clock forward by one day, restarted my middle-tier services (actually only the process manager: OracleasProcessManager in my case), reconnected to Plus, and launched the Discoverer Scheduling Manager. Now, my system clock said something like Nov 30, 2005, 4:15pm. Therefore, all results from Nov 29 that had run before 4:15pm should have expired. If you take a look at the screenshot below, it will confirm the same: four results have expired and will be deleted.
 Results of scheduled workbooks are stored in tables in the EUL. This means that for every run of a scheduled workbook, one table is created in the EUL. If you were to list all the tables in the EUL, prior to deleting the expired results, you get 62 results.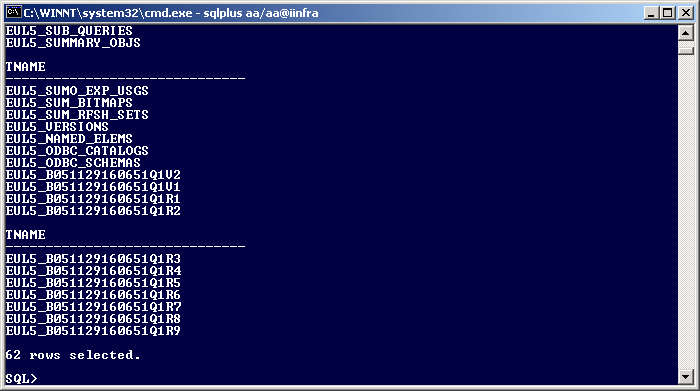 Exit Discoverer Plus, and you are prompted with a dialog asking you to confirm the deletion.
 Click 'OK' and the results are deleted. Which means that four tables sould have been deleted from the EUL. To confrm that, rerun the SQL command to list all the tables in the EUL (select tname from tab;). As expected, the EUL now has four tables less than before.
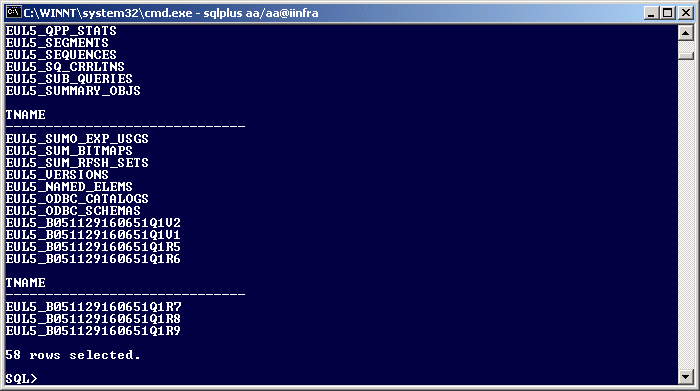 You could try different options, but the bottom line is that the results become due for expiration and thus deletion when they are more than 24 hours old in this case.
Monday, November 14, 2005
Oracle XE Database and Discoverer - 3 - Opening and Creating Workbooks
So far I have covered installing the XE database on a Windows 2000 machine (see link to earlier post on the topic), and connecting Discoverer Administrator to the XE database to create an EUL and import the Video Stores tutorial data (see this link to an earlier post on creating an EUL on an XE database).
In this post I cover (briefly) connecting Discoverer Plus relational to the EUL. I used the connect directly option in the Discoverer connections page to connect to the 'AA' EUL hosted on the XE database. After Plus launched, I verified that I was indeed connected as user 'AA' against an XE database to the 'AA' EUL. The reason I verified this every time connected is because I have three databases running on my laptop: a 10.1.0.4 infrastructure database, another 10.1.0.4 database for OLAP (I don't want to use the infrastructure database for OLAP, even though it is an enterprise edition version with OLAP, Data Mining, and Partitioning options available), and now the XE database (10.2.0.1). It would do me no good if I made a mistake when entering the connection details and ended up connecting to one of the other two databases (my tnsnames.ora file has entries for all three databases).
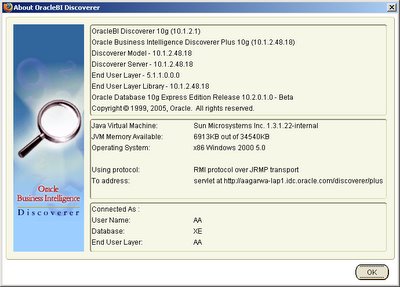
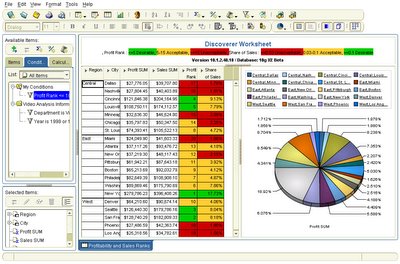
Having verified that Plus was connected to an XE database ("Oracle Database 10g Express Edition" to be propah), I now wanted to see if I could create a simple report, then proceed to create some analytic calculations, share the workbook, schedule it - basically do some basic sanity testing. Oh, and yes, open the workbook in Viewer, and go through the typical steps that a user would go through.
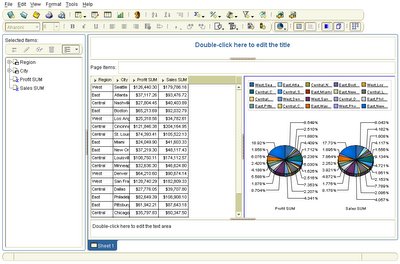
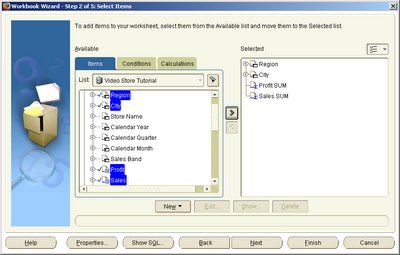 A simple tabular report with Region, City, Profit and Sales turned up nicely. A multi-pie chart added to the appeal!
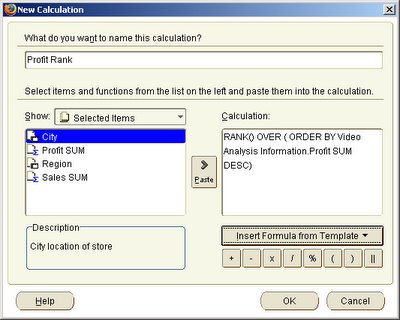
 On to creating an analytic calculation. Here is the first analytic calc being created - a rank of cities by Profit. The calculation itself is:
RANK() OVER (ORDER BY Video Analysis Information.Profit SUM DESC)
Discoverer itself would not perform this calculation: it would simply include the sql in the worksheet SQL and pass it to the database. Therefore, if this worked, it would mean that XE was also able to compute SQL analytic functions.
Added a second calculation for share of Sales by city for all regions, added a stoplight format each to the two analytic calculations, edited the sheet title, renamed the sheet, saved it, re-opened it, and everything worked like clockwork!
 Also opened the worksheete in Viewer, made some layout changes, saved the changes back, and re-opened the worksheet in Plus.
Here is the actual SQL that Discoverer generated:
Related posts:
In this post I cover (briefly) connecting Discoverer Plus relational to the EUL. I used the connect directly option in the Discoverer connections page to connect to the 'AA' EUL hosted on the XE database. After Plus launched, I verified that I was indeed connected as user 'AA' against an XE database to the 'AA' EUL. The reason I verified this every time connected is because I have three databases running on my laptop: a 10.1.0.4 infrastructure database, another 10.1.0.4 database for OLAP (I don't want to use the infrastructure database for OLAP, even though it is an enterprise edition version with OLAP, Data Mining, and Partitioning options available), and now the XE database (10.2.0.1). It would do me no good if I made a mistake when entering the connection details and ended up connecting to one of the other two databases (my tnsnames.ora file has entries for all three databases).
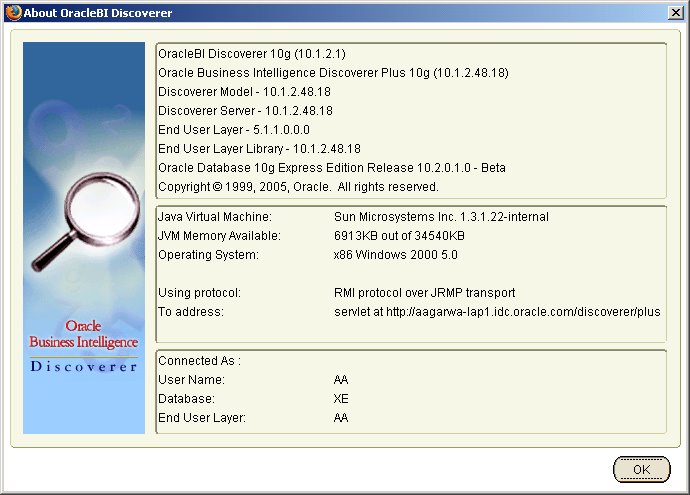
Having verified that Plus was connected to an XE database ("Oracle Database 10g Express Edition" to be propah), I now wanted to see if I could create a simple report, then proceed to create some analytic calculations, share the workbook, schedule it - basically do some basic sanity testing. Oh, and yes, open the workbook in Viewer, and go through the typical steps that a user would go through.
 A simple tabular report with Region, City, Profit and Sales turned up nicely. A multi-pie chart added to the appeal!
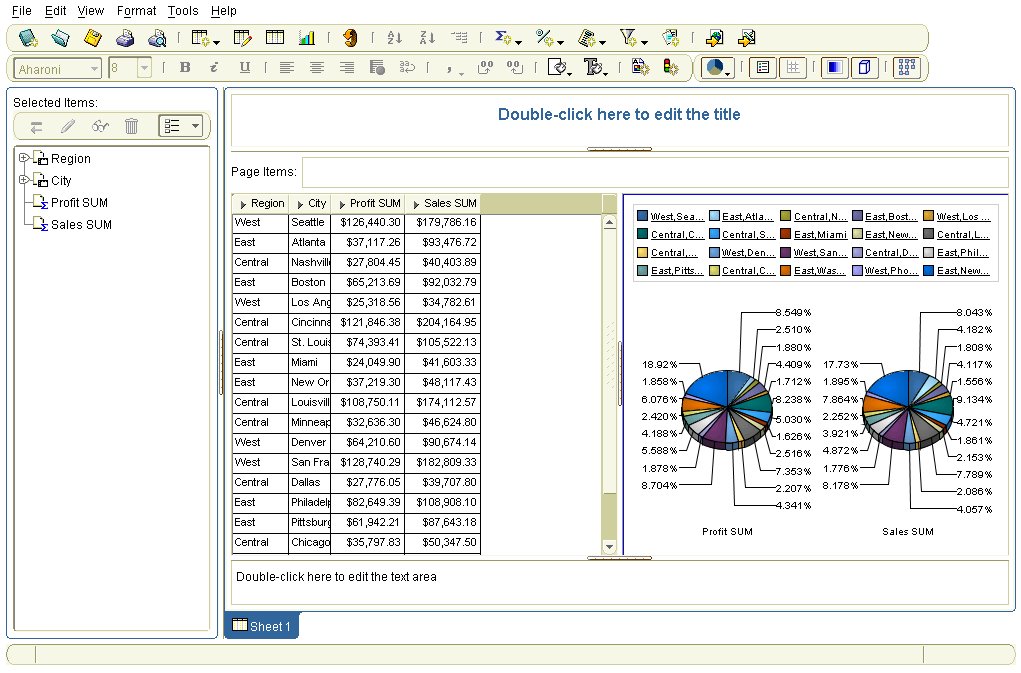 On to creating an analytic calculation. Here is the first analytic calc being created - a rank of cities by Profit. The calculation itself is:
RANK() OVER (ORDER BY Video Analysis Information.Profit SUM DESC)
Discoverer itself would not perform this calculation: it would simply include the sql in the worksheet SQL and pass it to the database. Therefore, if this worked, it would mean that XE was also able to compute SQL analytic functions.

Added a second calculation for share of Sales by city for all regions, added a stoplight format each to the two analytic calculations, edited the sheet title, renamed the sheet, saved it, re-opened it, and everything worked like clockwork!
 Also opened the worksheete in Viewer, made some layout changes, saved the changes back, and re-opened the worksheet in Plus.
Here is the actual SQL that Discoverer generated:
For readability, I copied this, removed a couple of items, and ran this on my XE database using SQL*Plus:SELECT o100027.CITY as E100123,o100027.REGION as E100155,RANK() OVER(PARTITION BY ( GROUPING_ID(o100027.CITY,o100027.REGION) ) ORDER BY ( SUM(o100026.PROFIT) ) DESC ) as C_2,SUM(o100026.PROFIT) as E100153_SUM,RATIO_TO_REPORT(( SUM(o100026.SALES) )) OVER(PARTITION BY ( GROUPING_ID(o100027.CITY,o100027.REGION) ) ) as C_1,SUM(o100026.SALES) as E100161_SUM,GROUPING_ID(o100027.CITY,o100027.REGION) as GID
FROM VIDEO5.SALES_FACT o100026, VIDEO5.STORE o100027
WHERE ( (o100027.STORE_KEY = o100026.STORE_KEY))
GROUP BY GROUPING SETS(( o100027.CITY,o100027.REGION ),( o100027.CITY ))
HAVING (GROUP_ID()=0)
ORDER BY GID DESC;
SQL*Plus: Release 10.2.0.1.0 - Beta on Mon Nov 14 12:41:42 2005So far, I have not found anything that hasn't worked on XE; but then again, I have not tried out a whole lot of things that depend on functionality that may not be available on XE. Partitioning for one is not available on XE, nor is Data Mining and OLAP functionality. More in the next post.
Copyright (c) 1982, 2005, Oracle. All rights reserved.
Connected to:
Oracle Database 10g Express Edition Release 10.2.0.1.0 - Beta
SQL> SELECT
2 o100027.REGION as Region,
3 o100027.CITY as City,
4 RANK() OVER(ORDER BY ( SUM(o100026.PROFIT) ) DESC ) as Profit_Rank,
5 SUM(o100026.SALES) as Sales FROM VIDEO5.SALES_FACT o100026,
6 VIDEO5.STORE o100027
7 WHERE
8 ( (o100027.STORE_KEY = o100026.STORE_KEY))
9 GROUP BY o100027.CITY,
10 o100027.REGION
11 ORDER BY
12 o100027.REGION ASC
13 ;
REGION CITY PROFIT_RANK SALES
-------------------- ------------------------------ ----------- ----------
Central Cincinnati 4 204164.95
Central St. Louis 8 105522.13
Central Chicago 14 50347.5
Central Minneapolis 15 46624.8
Central Louisville 5 174112.57
Central Nashville 16 40403.89
Central Dallas 17 39707.8
East Atlanta 13 93476.72
East Boston 9 92032.79
East Philadelphia 7 108908.1
East Washington 6 175790.69
REGION CITY PROFIT_RANK SALES
-------------------- ------------------------------ ----------- ----------
East New Orleans 12 48117.43
East Pittsburgh 11 87643.18
East Miami 20 41603.33
East New York 1 396408.26
West Los Angeles 19 34782.61
West Phoenix 18 42363.74
West Denver 10 90674.14
West Seattle 3 179786.16
West San Francisco 2 182809.33
20 rows selected.
SQL>
Related posts:
Friday, November 11, 2005
List of all posts
Posts at a glance (in reverse chronological order)
A list of all the posts on this blog. I will update this list periodically. And also place a link to this post from the nav bar, for convenience.
Last updated: Oct 17 2006, 5:15 PM IST
A list of all the posts on this blog. I will update this list periodically. And also place a link to this post from the nav bar, for convenience.
Last updated: Oct 17 2006, 5:15 PM IST
- IDC Ranks Oracle No 1 in Business Analytics
- View this blog in multiple languages
- Spreadsheet Add-in - Refreshing multiple queries
- Why Is the blog getting so many hits
- Some blog stats
- Spreadsheet Add-In - non modal wizard
- Oracle Discoverer at OpenWorld
- Mere Paas BI Hai
- Welcoming Mike Durran as the new BI blogger
- X-Treme at Oracle OpenWorld
- Rename queries in Spreadsheet Add-In 10.1.2.2
- Discoverer 4i desupport for EBS 11i
- Office - Excel, Word, PowerPoint, Outlook, and more
- Know any product managers?
- Gartner on Oracle and Sigma Dynamics deal
- From Michael's blog
- More on OpenWorld and BI
- Oracle Open World and BI
- BI/DW Training at OpenWorld 2006
- OracleBI Spreadsheet Add-in advantages
- And a new BI blogger
- Row Banding in Oracle Answers
- Free OWB and DM Review seminar
- Winter Corp's Spotlight on Oracle White Paper
- Upcoming BI releases
- ODTUG Conference Day 2
- Live from ODTUG...Monday
- Two blog posts on ODTUG 2006
- Small but neat feature in 'Answers'
- New Graph styles in the upcoming Discoverer release
- OWB OBEs now available
- The Discoverer Handbook 10g on Amazon
- Oracle leads in DBMS marketshare - IDC and Gartner studies
- Firefix the memory hog
- Oracle Warehouse Builder 10gR2 (Paris) available for download
- Great Data Mining blog post on DM SQL
- Incremental fetch for graphs - totals only graphs
- Incremental Fetch in Graphs
- Discoverer presentations at ODTUG 2006 Kaleidoscope
- ODTUG Kaleidoscope 2006
- Market Share Analysis not rocket science
- Research Notes on Oracle BI
- In the US next week
- Day and a half versus an hour and ten minutes
- Great Analysis Article on Oracle BI From Bloor Research
- Graph displayed data in Viewer
- Oracle Data Miner 10.2.0.1 Tutorial Available
- Another Oracle Blog - on Apps Technology
- Download a sample chapter from the Discoverer 10g Handbook
- Poll results
- Final call to vote for your must-have Discoverer features
- ProClarity No More
- Take the poll for must-have Discoverer features
- Congratulations to Michael for his ACE Nomination
- Must Have In Discoverer
- Michael's Discoverer Blog is up and running now
- Oracle and Office Interoperability Center on OTN
- Oracle BI Suite Standard Edition
- Oracle's BI Strategy Briefing
- The Discoverer 10g Handbook from Michael Armstrong-Smith
- How To Customize The Export Formats List in Viewer
- Add A Quick Export Link to the Worksheet Page
- The Discoverer Blog from Michael Armstrong-Smith
- Oracle Development Survey on Data Warehouses: How Does Yours Compare? Here's how to find out!
- More Oracle Executive Blogs
- Day 2 of RMOUG Conference
- Rocky Mountain User Group Meeting,
- The Oracle Data Mining Blog
- Flash based introduction of Oracle Data Warehousing now available
- Blogs dot Oracle dot com - Finally here
- More on Oracle BI and Siebel Analytics
- Using Excel as a data source for building dimensions and cubes
- Blogs on Oracle.com coming soon?
- App Server 10.1.3 is now available
- How Do You Debug OLAP DML from BI Beans Part 2
- Press clippings in the media for Open World Mumbai
- All Open World Mumbai 2006 Links
- Siebel Analytics and the Oracle acquisition
- Other Open World Mumbai 2006 Vignettes
- Open World Mumbai 2006 - City photos 1
- Open World Mumbai - 4
- Webcast URL for Open World Mumbai 2006
- A couple of new docs available on OTN
- Open World Mumbi 2004 - Vignettes
- OOW Mumbai - 2
- OOW in Mumbai
- How Do You Debug OLAP DML from BI Beans?
- Standalone Discoverer 10g (10.1.2.0.2) clients now fully SSO compliant for E-Business Suite users
- UIX Hack 4 - Removing the worksheet breadcrumb
- From detail to summary in two clicks
- PDF Settings in Viewer
- Multiple Conditional Formats on the same item
- Discoverer Is Not Supported On XE
- Using BI Beans with non-OLAP data source
- Expiration of scheduled workbooks
- Oracle XE Database and Discoverer - 3 - Opening and Creating Workbooks
- List of all posts
- Oracle XE Database and Discoverer - 2 - Creating the EUL
- Beyond the BI Graph Wizard
- Going Beyond the BI Graph Wizard
- Oracle XE Database and Discoverer - 1 - Installing XE
- Intelligently building OLAP cubes with data mining
- Top Ten Design Mistakes for Weblogs
- Article: Oracle to pitch open-source database against Microsoft and Sybase
- More with the Spreadsheet Add-In - 10.1.2.1
- Using the Spreadsheet Add-In - 10.1.2.1
- Oracle's executive blogs
- Installing the Spreadsheet Add-In - 10.1.2.1
- New versions of AWM and Spreadsheet Add-In available
- Oracle Data Miner 10gR2 beta now available, with a Discoverer bridge
- Out of town, with a busy two weeks coming up...
- Queries you can easily understand.....
- Open World 2005 Attendance Graphs - with Discoverer
- More on the bubble graph
- Making more of BI Graphs....
- Creative Use of the IQY Export Format
- Loose lips sink ships
- Performance improvements and SQL optimizations
- Larry Ellison on BI
- On Vendor Weirdness
- UIX Hack 3 - Removing the 'type' column from a portlet
- How read is a blog before you can call it a well-read blog
- Activity Guide to OOW BI&DW Sessions
- Displaying only selected page items or parameters in the title
- And Then There Was One Less (Oracle buying Siebel)
- Record OpenWorld registrations
- UIX Hack 2 – Remove the Last Refresh Date from Discoverer Portlets
- Phase 2 Nugget - The navigator preferences
- Know More About Oracle BI
- BI at Oracle OpenWorld this year
- Oracle's BI strategy presentation
- Some Discoverer OLAP - D4O - queries answered
- UIX Hack 1 - Removing the 'Connect Directly' section
- BI Tools, Forms & Reports Services, and more now available for Phase 2
- Phase 2 available on Windows also
- Change PDF options when emailing reports
- Phase 2 Nugget - Change paper size in Plus
- 10.1.2.0.2 - Phase 2 is now available on OTN
- Phase 2 Doc is now available
- Passing a password to Viewer
- OLAP 10g R2 web seminar
- A first look at installing Discoverer using the Oracle Application Server - 10.1.2.0.2 (Phase 2)
- More on OTN Forums
- BI Forums on OTN
- Why You Should NOT Publish Large Worksheets to Portal
- Updating Multiple Discoverer Portlets Using Portal Page Parameters
- Welcome
Oracle XE Database and Discoverer - 2 - Creating the EUL
In my previous post (link to post) I installed an XE database version in my laptop, which went through successfully. The next step was to install a Discoverer EUL (link to Discoverer documentation on the EUL) After successfully installing the database, my next step was to see if I could get Discoverer to run against the database, and with what restrictions.
The first step in that direction (actually the second; the first step being the installation of the database itself) would be to create an EUL on the XE database.
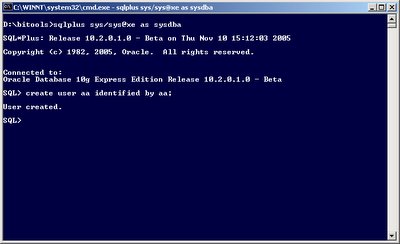
I created a user named 'aa' using trusty SQL*Plus and gave it the privileges required by Discoverer (you can get a list of the privileges in the Discoverer doc guide - link to Discoverer Administrator doc on OTN).
The first hurdle obviously was to see if Discoverer Administrator could even connect to XE (I couldn't think of any obvious reasons why it shouldn't).
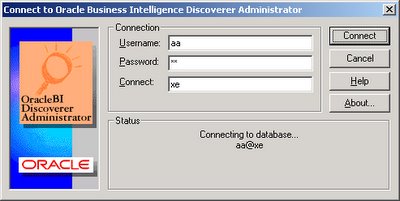
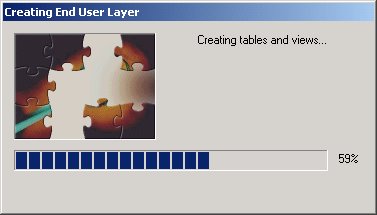
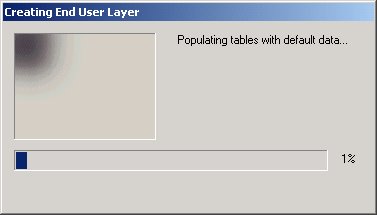
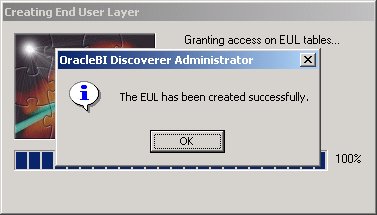
The connection was successful! The screen where Discoverer asks you to create an EUL is not here; I chose to create an EUL. Discoverer initiated the process of creating the EUL tables and views, and then populated them with default data.

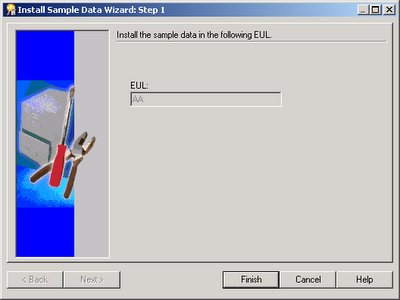
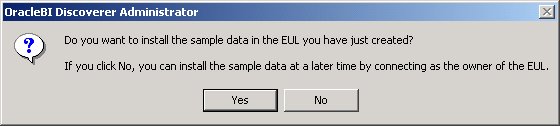
Once the EUL created successfully, the next step was to import the default Video Stores EUL. Actually, I didn't need to perform this step; I could have created a business area by hand, but this is simply convenient and quick.
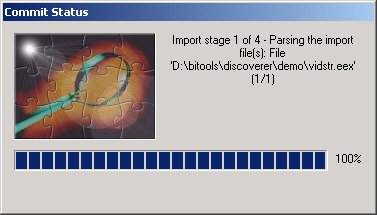
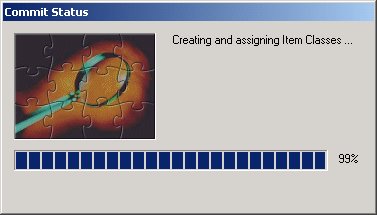
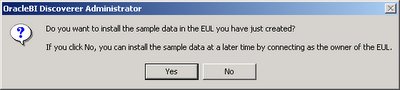 The Video Stores sample data installation also proceeded smoothly.


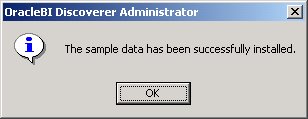 After this dialog, I quickly verified that all folders - simple, complex, and custom, hierarchies, LOVs, and summaries were correct. With the successful EUL creation and sample data import, I was now pretty confident that Plus / Viewer would work without issues. Some of the things I now wanted to check there were creation, sharing, scheduling, summary redirection, analytic calcs. On to the third post soon.
Previous related post: Oracle XE Database and Discoverer - 1 - Installing XE
The first step in that direction (actually the second; the first step being the installation of the database itself) would be to create an EUL on the XE database.
I created a user named 'aa' using trusty SQL*Plus and gave it the privileges required by Discoverer (you can get a list of the privileges in the Discoverer doc guide - link to Discoverer Administrator doc on OTN).

The first hurdle obviously was to see if Discoverer Administrator could even connect to XE (I couldn't think of any obvious reasons why it shouldn't).

The connection was successful! The screen where Discoverer asks you to create an EUL is not here; I chose to create an EUL. Discoverer initiated the process of creating the EUL tables and views, and then populated them with default data.


Once the EUL created successfully, the next step was to import the default Video Stores EUL. Actually, I didn't need to perform this step; I could have created a business area by hand, but this is simply convenient and quick.
 The Video Stores sample data installation also proceeded smoothly.


 After this dialog, I quickly verified that all folders - simple, complex, and custom, hierarchies, LOVs, and summaries were correct. With the successful EUL creation and sample data import, I was now pretty confident that Plus / Viewer would work without issues. Some of the things I now wanted to check there were creation, sharing, scheduling, summary redirection, analytic calcs. On to the third post soon.
Previous related post: Oracle XE Database and Discoverer - 1 - Installing XE
Beyond the BI Graph Wizard
This post is aimed at BI Beans developers wanting to fully exploit all the features of the BI Beans Graph. Within JDeveloper the easiest way to create a new graph is to use the Graph Wizard. This will allow you to create a new query to populate the graph and also define the layout. The end result is an XML file within the BIDesigner. This XML file is stored on the local file system. Before deploying your application this XML file has to be copied to the remote catalog so your application can correctly locate and open it.
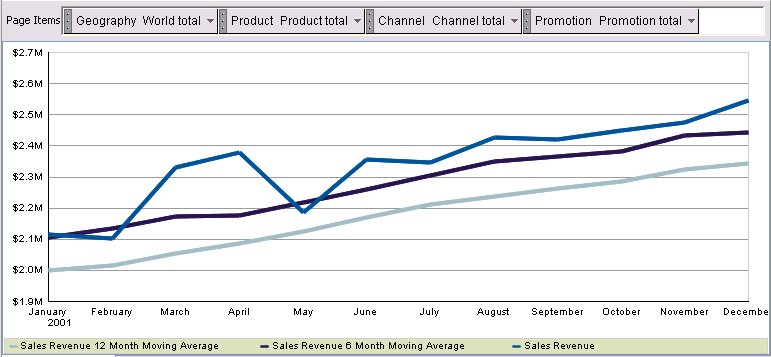
Once the graph has been created most of the properties relating to a graph are exposed using the customizer wizards that are part of the graph toolbar in JDeveloper. Using the GUI tools you can easily create a graph something like the one shown below, where the width of the lines has been increased and the colors for each line set to match a specific theme:
Some sections contain more detailed sections and are shown as drillable in the tree. For example the plotArea has an SFX section. This controls the Special Effects features. This is not exposed in the graph Wizard or the customizers, so the Properties panel has to be invoked to both view and modify these properties. To open the Properties panel use the (Ctrl+Shift+P) keystroke. The plotArea SFX has the following properties:
 Using the SFX properties graph developers can add features such as background images to a graph. By setting the fillType, textureDisplay and textureURL properties it is easy to update the graph shown above by adding a background image as shown below:


Once the graph has been created most of the properties relating to a graph are exposed using the customizer wizards that are part of the graph toolbar in JDeveloper. Using the GUI tools you can easily create a graph something like the one shown below, where the width of the lines has been increased and the colors for each line set to match a specific theme:
 These are very basic customizations. However, the BI Beans graph does contain a lot of properties that are not covered by either the graph wizard or the customizers. There are three basic ways to access these additional properties:
1) Use the Structure and Properties panels in JDeveloper
2) Directly editing the graph XML file
3) Use the graph Java API
Method 1 : Using the Structure and Properties panels in JDeveloper
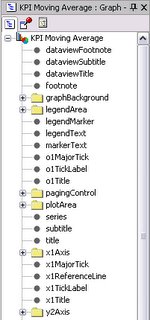
In JDeveloper the Structure and Properties panels can be used to view all the available graph properties. Once a graph is open in the JDeveloper graph editor, opening the Structure panel (Ctrl+Shift+S) will expose the all the structure of the graph bean:
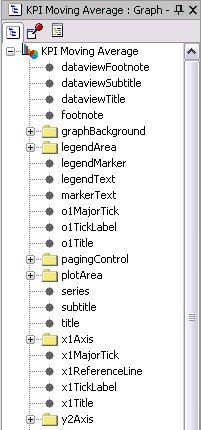
Some sections contain more detailed sections and are shown as drillable in the tree. For example the plotArea has an SFX section. This controls the Special Effects features. This is not exposed in the graph Wizard or the customizers, so the Properties panel has to be invoked to both view and modify these properties. To open the Properties panel use the (Ctrl+Shift+P) keystroke. The plotArea SFX has the following properties:
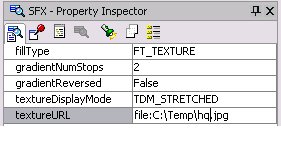 Using the SFX properties graph developers can add features such as background images to a graph. By setting the fillType, textureDisplay and textureURL properties it is easy to update the graph shown above by adding a background image as shown below:
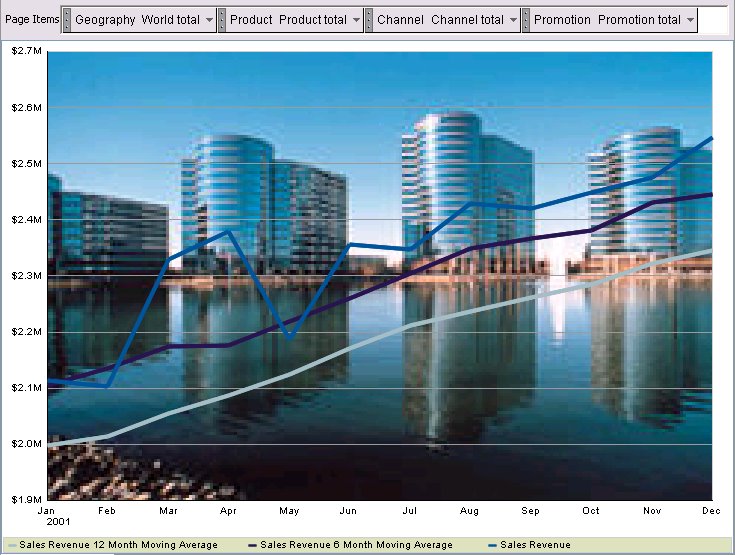
In the actual graph XML file the following additional tags are added to control the SFX features:
Another feature that is only exposed via the Properties panel is the ability to wrap the text for the various title areas. In order to word-wrap long titles you simply select the required title in the structure panel, for example the Y1 Title: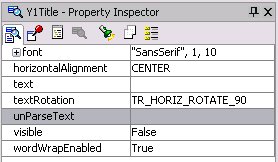
The Property panel then exposes the options such as word wrap, text rotation, alignment etc. In the graph XML file the following entry would be added:

Method 2 : Directly editing the graph XML file
If you really want to push the boundaries the next step for customizing graphs is to directly edit the graph XML. As stated above, the graph definition is saved to an XML file within the BIDesigner directory on the local file store. Developers can use any text editor to open the file and add new XML tags or edit existing tags to customize the appearance of the graph. After saving the file, in JDeveloper you only need to reload the graph to view the results of the changes to the file.
The BI Beans graph is shipped with a DTD document that lists all the available XML tags. You can see the complete list of graph attributes inside the file 'graph.dtd'. This DTD file is located in your JDEVELOPER_HOME\bibeans\lib\bipres.jar. The WinZip utility can be used to unzip the contents of this JAR file and view the dtd document. For detailed information on these attributes, refer to the technical note available on OTN from the Reports Product Management Team:
This Technical Note explains all these attributes using comments within the graph.dtd. This document will help to explain the usage of these various attributes that provide more fine-grained customization of graphs.
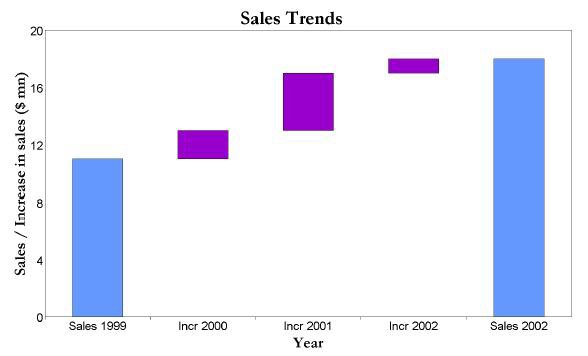
Directly editing the XML provides more opportunities to customize the visual representations of a graph. For example, BI Beans Graph does not provide a graph type that just plots the trend as a series of floating bars. However, by directly editing the XML it is possible to generate a graph that does have floating bars as shown below:

To do this is a two stage process. Assuming you have the following graph:

The first step is to add another series that clearly identifies the increase in sales for the years 2000-2002. Choose a stacked bar graph to show the two series. Your graph will now look like this:

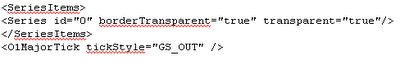
Once this has been done, the next step is to add the following to the graph xml document:

The O1 axis tick mark style is defined so that the floating bars can be identified easily with their respective labels on the X-axis. The above XML entry will make one of the series transparent, and you will get a floating effect as shown below:

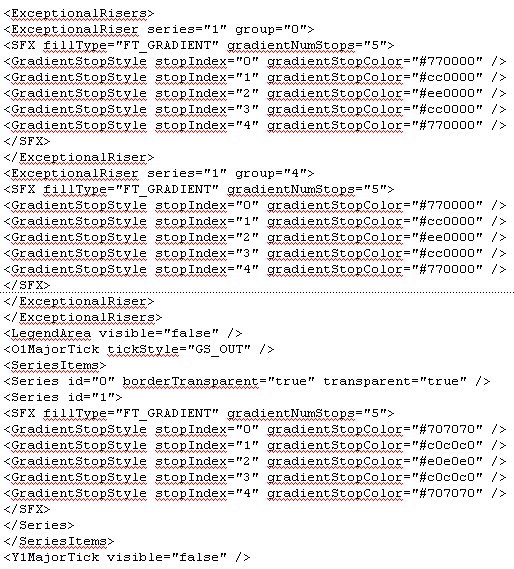
In order to show the total sales and increase in different colors, you will need to define exceptional risers. Exceptional risers are data markers that do not share series attributes, e.g., series color. Add the following to the Graph xml document to define exceptional risers:

This will change the color of the total sales bars as shown below:
To make the above graph look exactly like first graph with the nice red and silver bars some additional XML statements are required to modify the color codes used as part of the series definition and apply some special effects properties as well.
Method 3 : Using the graph Java API
The last method for interacting with the Graph bean is to use the Java API. This provides access to some interesting features such as the ability to set the bars or pie slices transparent. Currently the only way to set this property is to call the graph bean API using java code as follows:
DataAccess da = graph.getModel().getDataAccess();
int seriesCount = da.getEdgeExtent(DataDirector.ROW_EDGE);
for (int i=0; i
try{
graph.getSeries().setColor(new Color(red,green,blue,alpha), i);
}
catch (SeriesOutOfRangeException se){
System.out.println(" Series out of Bound Exception ");
}
}
This method uses the constructor for Color: Color(int r, int g, int b, int a) and creates an sRGB color with the specified red, green, blue, and alpha values in the range (0 - 255). The result is as follows: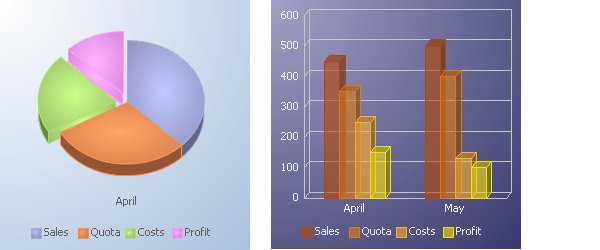
Going Beyond the BI Graph Wizard
This post is aimed at BI Beans developers wanting to fully exploit all the features of the BI Beans Graph. Within JDeveloper the easiest way to create a new graph is to use the Graph Wizard. This will allow you to create a new query to populate the graph and also define the layout. The end result is an XML file within the BIDesigner. This XML file is stored on the local file system. Before deploying your application this XML file has to be copied to the remote catalog so your application can correctly locate and open it.
Once the graph has been created most of the properties relating to a graph are exposed using the customizer wizards that are part of the graph toolbar in JDeveloper. Using the GUI tools you can easily create a graph something like the one shown below, where the width of the lines has been increased and the colors for each line set to match a specific theme:
Once the graph has been created most of the properties relating to a graph are exposed using the customizer wizards that are part of the graph toolbar in JDeveloper. Using the GUI tools you can easily create a graph something like the one shown below, where the width of the lines has been increased and the colors for each line set to match a specific theme:
These are very basic customizations. However, the BI Beans graph does contain a lot of properties that are not covered by either the graph wizard or the customizers. There are three basic ways to access these additional properties:
1) Use the Structure and Properties panels in JDeveloper
2) Directly editing the graph XML file
3) Use the graph Java API
Method 1 : Using the Structure and Properties panels in JDeveloper
In JDeveloper the Structure and Properties panels can be used to view all the available graph properties. Once a graph is open in the JDeveloper graph editor, opening the Structure panel (Ctrl+Shift+S) will expose the all the structure of the graph bean:

Some sections contain more detailed sections and are shown as drillable in the tree. For example the plotArea has an SFX section. This controls the Special Effects features. This is not exposed in the graph Wizard or the customizers, so the Properties panel has to be invoked to both view and modify these properties. To open the Properties panel use the (Ctrl+Shift+P) key stroke. The plotArea SFX has the following properties: Using the SFX properties graph developers can add features such as background images to a graph. By setting the fillType, textureDisplay and textureURL properties it is easy to update the graph shown above by adding a background image as shown below:
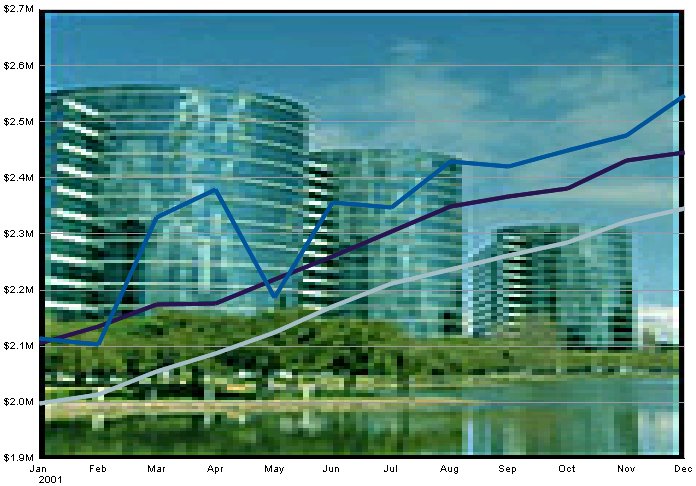 In the actual graph XML file the following additional tags are added to control the SFX features:
 By changing the textureDisplayMode to "TDM_TILED" we can create the following effect:

These effects are similar to the options available within the Windows displays properties for your Desktop, where you can use an image and have it stretched or tiled across your display.
Another feature that is only exposed via the Properties panel is the ability to wrap the text for the various title areas. In order to word-wrap long titles you simply select the required title in the structure panel, for example the Y1 Title:

The Property panel then exposes the options such as word wrap, text rotation, alignment etc. In the graph XML file the following entry would be added:
Method 2 : Directly editing the graph XML file
If you really want to push the boundaries the next step for customizing graphs is to directly edit the graph XML. As stated above, the graph definition is saved to an XML file within the BIDesigner directory on the local file store. Developers can use any text editor to open the file and add new XML tags or edit existing tags to customize the appearance of the graph. After saving the file, in JDeveloper you only need to reload the graph to view the results of the changes to the file.
The BI Beans graph is shipped with a DTD document that lists all the available XML tags. You can see the complete list of graph attributes inside the file 'graph.dtd'. This DTD file is located in your JDEVELOPER_HOME\bibeans\lib\bipres.jar. The WinZip utility can be used to unzip the contents of this JAR file and view the dtd document. For detailed information on these attributes, refer to the technical note available on OTN from the Reports Product Management Team:
This Technical Note explains all these attributes using comments within the graph.dtd. This document will help to explain the usage of these various attributes that provide more fine-grained customization of graphs.
Directly editing the XML provides more opportunities to customize the visual representations of a graph. For example, BI Beans Graph does not provide a graph type that just plots the trend as a series of floating bars. However, by directly editing the XML it is possible to generate a graph that does have floating bars as shown below:
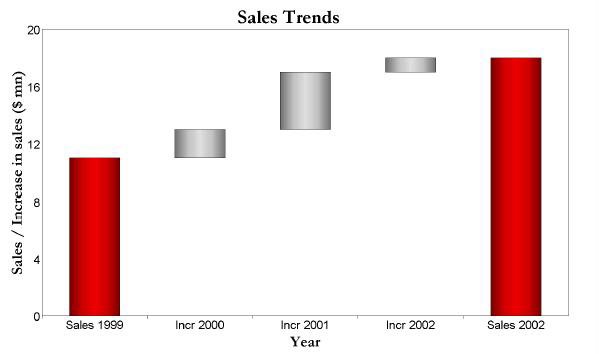
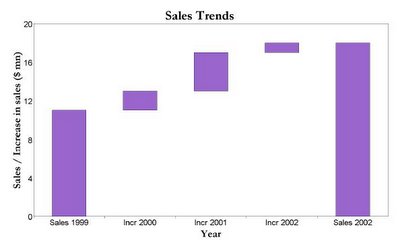
To create a graph like this is a two stage process. Assuming you have the following graph: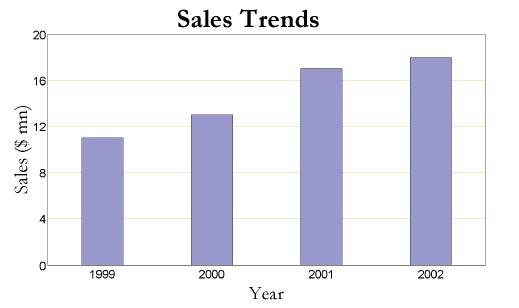
The first step is to add another series that clearly identifies the increase in sales for the years 2000-2002. Choose a stacked bar graph to show the two series. Your graph will now look like this: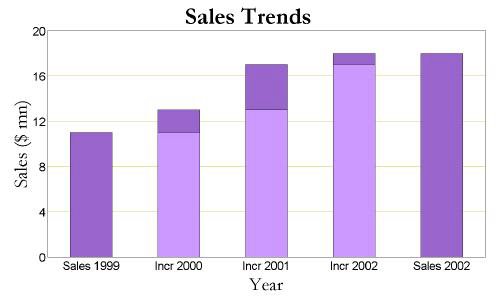
Once this has been done, the next step is to add the following to the graph xml document:
The O1 axis tick mark style is defined so that the floating bars can be identified easily with their respective labels on the X-axis. The above XML entry will make one of the series transparent, and you will get a floating effect as shown below:
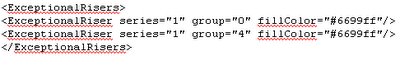
In order to show the total sales and increase in different colors, you will need to define exceptional risers. Exceptional risers are data markers that do not share series attributes, e.g., series color. Add the following to the Graph xml document to define exceptional risers: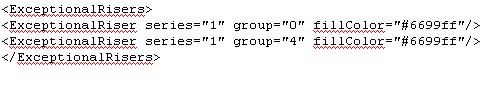
This will change the color of the total sales bars as shown below:
To make the above graph look exactly like first graph with the nice red and silver bars some additional XML statements are required to modify the color codes used as part of the series definition and apply some special effects properties as well.

Method 3 : Using the graph Java API
The last method for interacting with the Graph bean is to use the Java API. This provides access to some interesting features such as the ability to set the bars or pie slices transparent. Currently the only way to set this property is to call the graph bean API using java code as follows:
DataAccess da = graph.getModel().getDataAccess();
int seriesCount = da.getEdgeExtent(DataDirector.ROW_EDGE);
for (int i=0; i
try{
graph.getSeries().setColor(new Color(red,green,blue,alpha), i);
}
catch (SeriesOutOfRangeException se){
System.out.println(" Series out of Bound Exception ");
}
}
This method uses the constructor for Color: Color(int r, int g, int b, int a) and creates an sRGB color with the specified red, green, blue, and alpha values in the range (0 - 255). The result is as follows: 
Subscribe to:
Posts (Atom)